D2C Data Analytics
D2C Data Analytics in E-Commerce Growth
Most D2C brands have more data than they know what to do with. Shopify is giving you numbers. GA4 is giving you different numbers. The Meta ads dashboard has its own version. Klaviyo has another. And somewhere in a spreadsheet, someone is trying to reconcile all of it.
The problem is not too little data. It is too little clarity on what the data actually means. One analytics agency that audited 50-plus Shopify stores found that a client's store was reporting a 2.1 percent conversion rate in Shopify while GA4, with bot filtering enabled, showed 3.4 percent. The real human conversion rate was 60 percent higher than the dashboard suggested. Decisions were being made on the wrong number. That is an expensive problem to have when those decisions involve ad spend, product development, and pricing.
At Suplex Design, our team sets up D2C data analytics properly. Not just the tracking. The whole system. The right metrics, clean attribution, and dashboards that tell you what is actually happening rather than what looks good.
What D2C Data Analytics Actually Covers
Analytics for a D2C brand is not one tool. It is a stack of data sources that need to talk to each other and be interpreted together.
GA4 tells you about traffic sources, on-site behaviour, and conversion funnels. Shopify Analytics gives you product performance, repeat purchase data, customer lifetime value, and cohort behaviour. Klaviyo shows you email and SMS performance and how retention campaigns are actually performing. Meta and Google ads platforms give you campaign-level data, but their attribution models frequently conflict with each other and with what GA4 is showing.
None of these, on their own, tells you what to do next. The brands that grow consistently are the ones that have figured out how to use all of them together to ask the right questions. Which products are growing margin, not just revenue? Which acquisition channels are bringing customers who actually come back? Where in the funnel are we losing people we should be converting?
That is what D2C data analytics is for, not dashboards for their own sake, but answers that drive decisions.
How Suplex Design Approaches D2C Data Analytics
You will find that most agencies set up tracking and hand over a dashboard. At Suplex Design, our team starts with a different question. What decisions does this brand actually need to make, and what data does it need to make them properly? Everything else follows from that.
Analytics Audit First
Before setting up anything new, we audit what is already there. In our experience at Suplex Design, most stores have tracking problems they do not know about. GA4 events firing incorrectly. Purchase events double-counting. Shopify's official GA4 integration missing critical events like view_item_list, add_to_cart, and add_shipping_info that require additional configuration beyond the default setup.
We have seen stores where the data being used to make weekly ad spend decisions was systematically wrong for months. Decisions made on bad data are not just uninformed. They are actively misleading.
GA4 Setup and Event Tracking
GA4 is the foundation. But the default Shopify integration only tracks a subset of the events a D2C brand actually needs. Our team configures GA4 to capture the full e-commerce event set, including product views, list views, add-to-cart, begin-checkout, add-shipping-info, add-payment-info, and purchase. Each of these is a signal about where buyers are in the funnel and where they are dropping off.
We also configure GA4 to filter bot traffic, staff sessions, and preview link visits. Shopify's session counting includes all of these by default, which is why Shopify's conversion rate often looks lower than GA4's. Knowing which number to trust and why matters for every conversion rate conversation the brand will ever have.
Attribution Modelling
Attribution is genuinely hard now. iOS 14.5 introduced tracking transparency requirements that caused 60 to 70 percent of iOS users to opt out of cross-app tracking. iOS 17 added link tracking protection that strips URL parameters. Third-party cookie deprecation continues to roll out. The result is that brands running meaningful ad spend are seeing 20 to 40 percent of conversions appearing as unknown sources in their dashboards.
This is not a technical failure. It is the current reality. And the brands that are navigating it best are the ones that have set up multiple attribution signals rather than relying on a single platform's reporting.
Our team at Suplex Design configures server-side tracking where the brand's setup supports it, sets up UTM parameter discipline across all channels, and implements the Conversions API for Meta to recover signal lost to browser-level blocking. For brands with meaningful ad budgets, we also introduce tools like Triple Whale or Polar Analytics that model multi-touch attribution across channels rather than defaulting to last-click.
The Metrics That Actually Drive Decisions
Talking about which metrics actually matter for a D2C brand, the list is shorter than most dashboards suggest.
Contribution margin per order, not just revenue, because revenue growth that is being absorbed by rising fulfilment costs and payment fees is not real growth. Customer acquisition cost by channel, not blended, because a blended CAC hides which channels are working and which are quietly destroying margin. Repeat purchase rate and cohort retention, because a brand with strong new customer acquisition but poor retention is running a leaky bucket. LTV by acquisition channel, because customers acquired through different channels behave very differently over their lifetime.
These are the numbers that tell a brand whether it is actually building something durable or just generating transactions. The dashboards we build at Suplex Design are organised around these, not around vanity metrics that look good in a monthly report.
Dashboard Design and Reporting Cadence
A dashboard that nobody looks at is not an asset. It is a waste of setup time.
Our team designs dashboards specifically for how the brand's team actually operates. A founder who checks one number every morning needs something different from a growth team that reviews weekly performance across multiple channels. We build for the actual user, not for the most comprehensive possible view. Simpler dashboards get used. Complex ones get ignored.
We also set up a reporting cadence. Daily for the metrics that need daily attention like ad spend efficiency and revenue. Weekly for funnel performance, channel breakdown, and cohort data. Monthly for LTV, retention, and margin analysis. These are the rhythms that make data useful rather than decorative.

Tools and Technology
Suplex Design works with GA4 as the primary analytics layer, Shopify Analytics for commerce-specific data, Klaviyo for retention and email performance, Meta and Google Ads for campaign attribution, and tools like Triple Whale or Polar Analytics for multi-touch attribution modelling where the ad budget justifies it. For brands that need unified cross-functional reporting, we also work with Looker Studio for custom dashboard builds that pull from multiple sources into a single view. Server-side tracking is configured through Google Tag Manager Server where the brand's infrastructure supports it.
Is D2C Analytics Consultation Right for You?
Worth asking early. D2C analytics work is most useful in a few specific situations.
You are scaling ad spend and your attribution is getting unreliable. You have data but nobody agrees on which numbers to use for decisions. You are making product, pricing, or marketing decisions and not confident the data underneath them is clean. Or you have recently migrated to a new platform or analytics tool and want to make sure the tracking is set up correctly rather than finding out later that it was not.
If your analytics are clean, your attribution is solid, and your team is making confident data-driven decisions, this is probably not what you need right now. But that situation is rarer than most brands realise until someone actually audits what is underneath the dashboard.
Common Mistakes in D2C Analytics Setup
Consistent. Predictable. Expensive.
- Using Shopify's default conversion rate without filtering bot traffic, staff visits, and API calls that inflate session counts and deflate the conversion rate number. Decisions made on this figure are systematically wrong.
- Relying on a single platform's attribution model, typically Meta or Google, rather than triangulating across sources. Both platforms will claim credit for conversions the other channel influenced.
- Tracking revenue without tracking contribution margin. A brand growing revenue at 30 percent while its contribution margin per order is shrinking is not winning, it is just growing its problem.
- Building dashboards before deciding what questions the brand needs to answer. This produces comprehensive dashboards full of metrics nobody acts on.
- Not auditing the GA4 event setup after a Shopify theme update or app installation, both of which can silently break tracking without any obvious error message.
- Looking at average conversion rate and average CAC without breaking them down by channel, device, and product category, which hides the differences that actually drive decisions.
Why D2C Analytics Matters
The brands that grow consistently are not the ones with the best products or the highest ad budgets. They are the ones that make better decisions faster because they have better information.
Talking about the commercial stakes here, a brand spending meaningfully on paid acquisition that has a 25 percent attribution error rate is not just missing information. It is reallocating budget away from channels that are working and toward channels that look like they are working but are being credited with conversions they did not produce. At scale, that is a significant misallocation.
Clean analytics is not a reporting exercise. It is a competitive advantage. The brand that knows its real CAC by channel, its real LTV by cohort, and its real contribution margin per order is making faster, better decisions than the one that knows its blended revenue and its Shopify-reported conversion rate.
How Suplex Design Approaches D2C Analytics for Your Brand
Every analytics engagement at Suplex Design starts with an audit of what is already in place and an honest assessment of where the gaps are. There is ideally no standard dashboard template and no default event configuration. The setup is built around the brand's actual commercial questions and the team's actual decision-making rhythm.
Data problems, unsure whether the tracking is clean, making decisions on numbers you do not fully trust? Get in touch with Suplex Design.

Frequently Asked Questions
What D2C analytics services does Suplex Design offer?
GA4 setup and event tracking configuration, Shopify analytics review, attribution modelling across channels, custom dashboard design, and reporting cadence setup. We also audit existing analytics setups for brands that are not confident their current tracking is giving them accurate data. Most brands that have not had a proper audit have at least one significant tracking problem they do not know about.
How much does D2C analytics setup cost at Suplex Design?
Honestly it depends on what needs doing. A focused GA4 setup and event configuration for a straightforward Shopify store typically starts from around $800 at Suplex Design. A more comprehensive engagement covering attribution modelling, multi-touch reporting tools, and custom dashboard builds costs more. We scope clearly before starting.
Our Shopify conversion rate and GA4 conversion rate are very different. Which one is right?
Neither is fully right, and this is actually one of the most common things we sort out at Suplex Design. Shopify counts sessions that include bot traffic, staff visits, and API calls, which inflates session counts and deflates conversion rate. GA4 with proper bot filtering usually shows a higher, more accurate rate. We can audit both setups and give you a clear picture of which number to use and why.
Do you help with attribution problems caused by iOS privacy changes?
Yes. Attribution has become significantly harder since iOS 14.5, and brands running meaningful ad spend are routinely seeing 20 to 40 percent of conversions appearing as unknown sources. Suplex Design configures server-side tracking, implements the Meta Conversions API to recover lost signal, and introduces multi-touch attribution tools where the ad budget makes it worthwhile. Not a perfect fix, but meaningfully better than the default.
Do you provide ongoing analytics support after the initial setup?
Yes, absolutely. Analytics setups break. Theme updates and new app installations can silently affect tracking. Attribution models need revisiting as the channel mix changes. Suplex Design offers ongoing analytics support so the data stays clean and the dashboards stay useful rather than gradually drifting from reality without anyone noticing.
Let’s Make It Happen
Shopify Success Stories
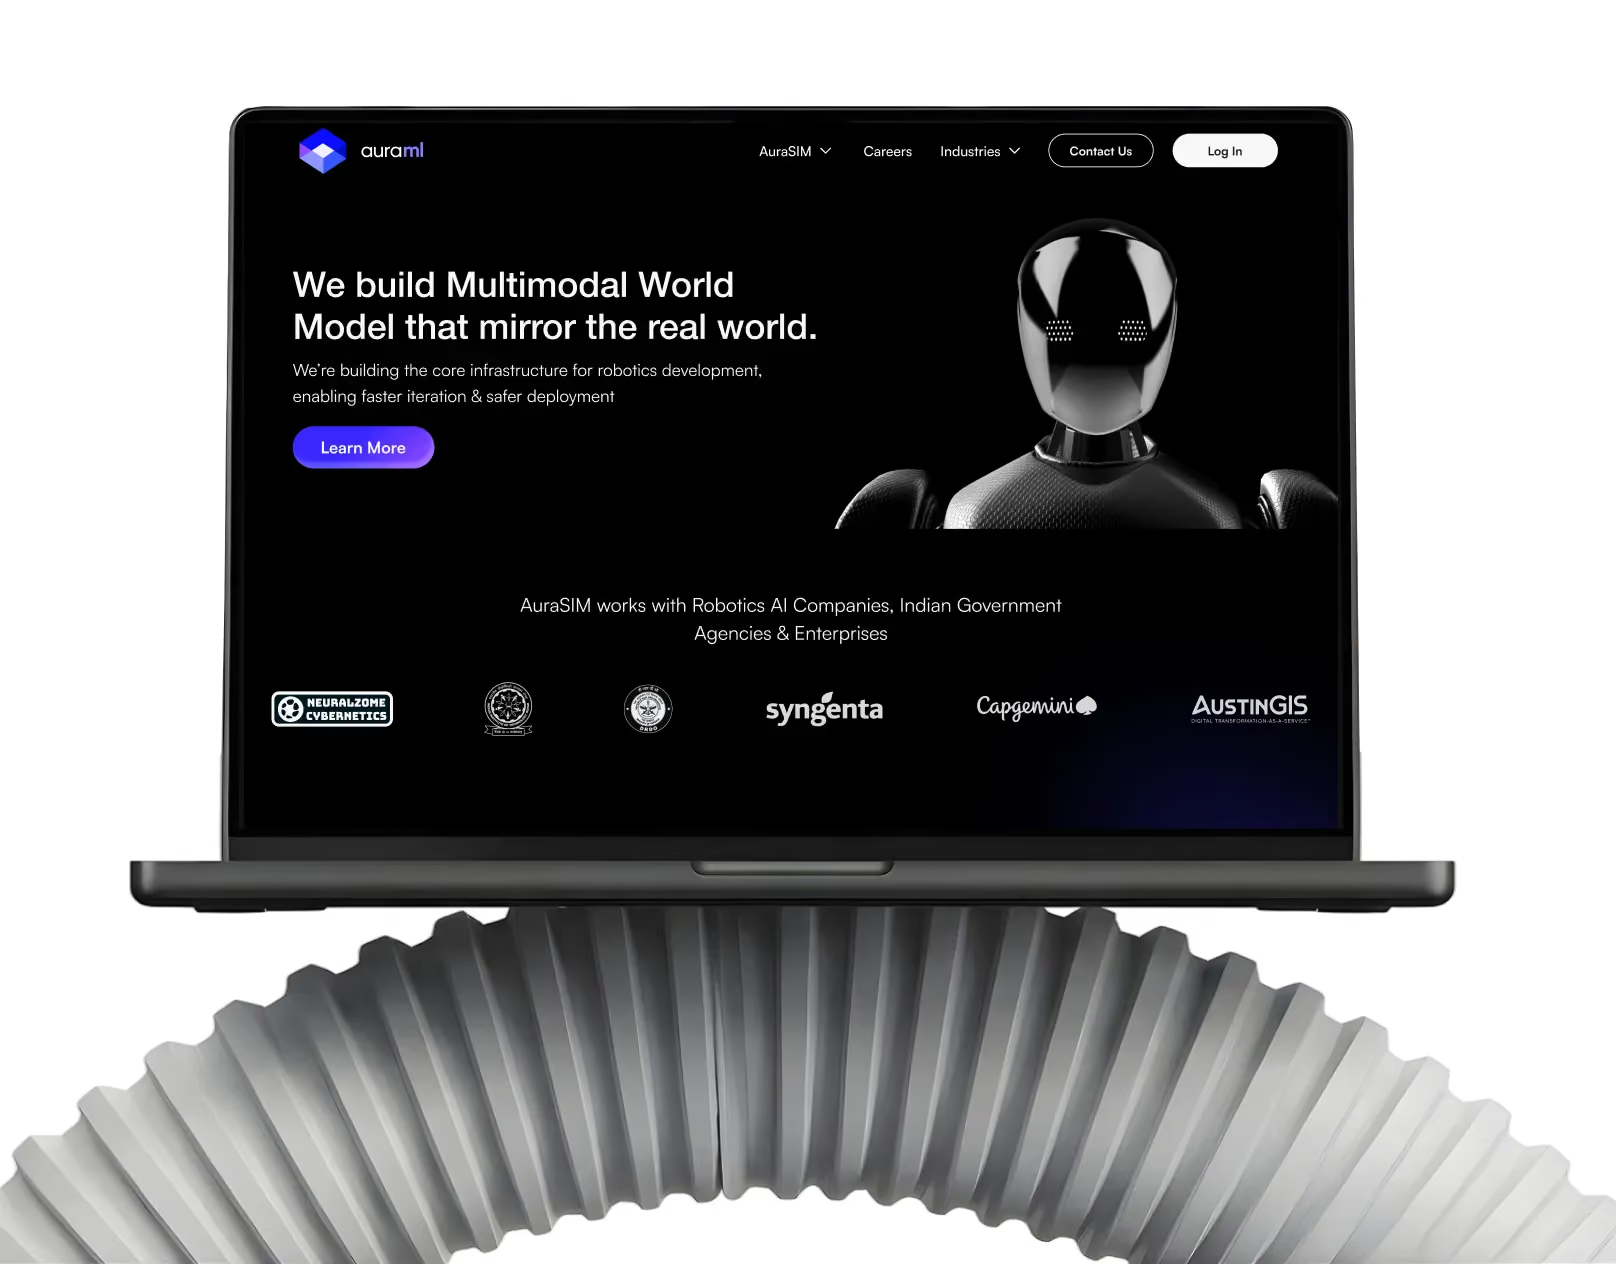
AuraML
How Suplex helped AuraSIM shift from a simulation tool to the brand that makes physical AI feel ready for the real world.

Tea Culture of the World
How Suplex made 120 teas from across the world feel like a discovery rather than a decision.

Great Lakes
How Suplex built a full stack website for a Midwest tequila brand with a real production story.
Why Suplex?
World Class Aesthetics
.webp)
Profitable E-Commerce
.webp)
Build A Brand
.webp)
Build Your D2C Business The Right Way
Build It With Suplex.


