Ecommerce Website Performance Optimization: The Complete Guide to Speed, Conversions & Revenue
.avif)

Ecommerce Website Performance Optimization: The Complete Guide to Speed, Conversions & Revenue
Vodafone increased sales by 8% after improving LCP by 31%, while Rakuten saw a 33% conversion lift and 53% higher revenue per visitor after optimizing Core Web Vitals.
A 1-second delay in load time can reduce conversions by 4.4%, and with 78.7% of UAE ecommerce orders now placed on mobile, speed directly impacts revenue. Yet only 39% of ecommerce sites pass all three Core Web Vitals.
This blog breaks down the key performance optimizations that improve speed, UX, and conversions across the entire ecommerce stack.
Why Most Ecommerce Performance Guides Get It Wrong
Most performance optimization articles give you a list of 10 or 15 tactics with no sequencing logic, compress images, minify CSS, enable caching, and defer JavaScript.
The problem is not that the tactics are wrong, it is that implementing them in the wrong order produces no measurable result and brands conclude that performance optimization does not move their numbers.
The real issue is prioritization and sequencing, not the individual fixes.
The Difference Between a Good PageSpeed Score and a Fast Store
A PageSpeed Insights score of 90 does not mean your store is fast for real users. This is the most consequential misconception in ecommerce performance optimization and it is responsible for enormous amounts of wasted development time.
PageSpeed Insights runs a Lighthouse audit against a simulated device on a controlled network.
Your customers are on real phones, on variable 4G connections, switching between apps, with multiple browser tabs open and social media pixels firing simultaneously.
Those conditions produce a fundamentally different performance experience than a lab simulation reflects.
Google's Core Web Vitals ranking signals come from the Chrome User Experience Report (CrUX) field data aggregated from real Chrome browser sessions by actual visitors to your store.
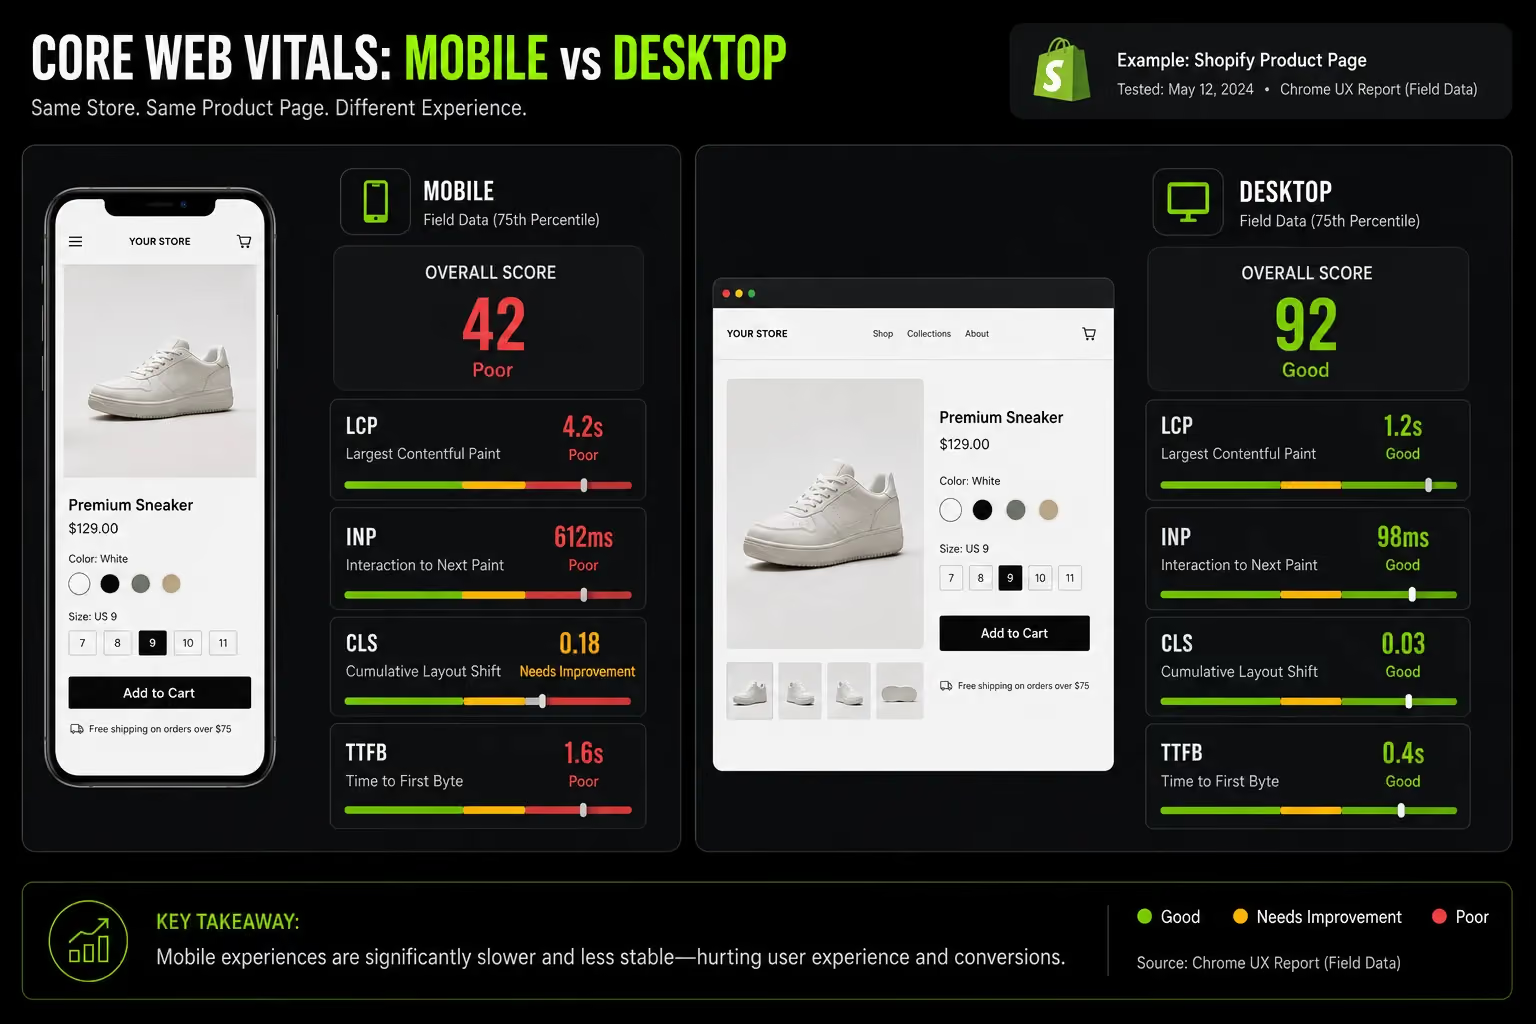
That data and your PageSpeed lab score frequently diverge. A Shopify store can score 85 on desktop PageSpeed and fail Core Web Vitals on mobile because the lab test cannot replicate the cumulative weight of third-party scripts, unoptimized themes, and real network variability.
Brands that optimize for the score rather than the experience improve a proxy metric while revenue stays flat.
Performance Is Not One Problem: It Is a Stack
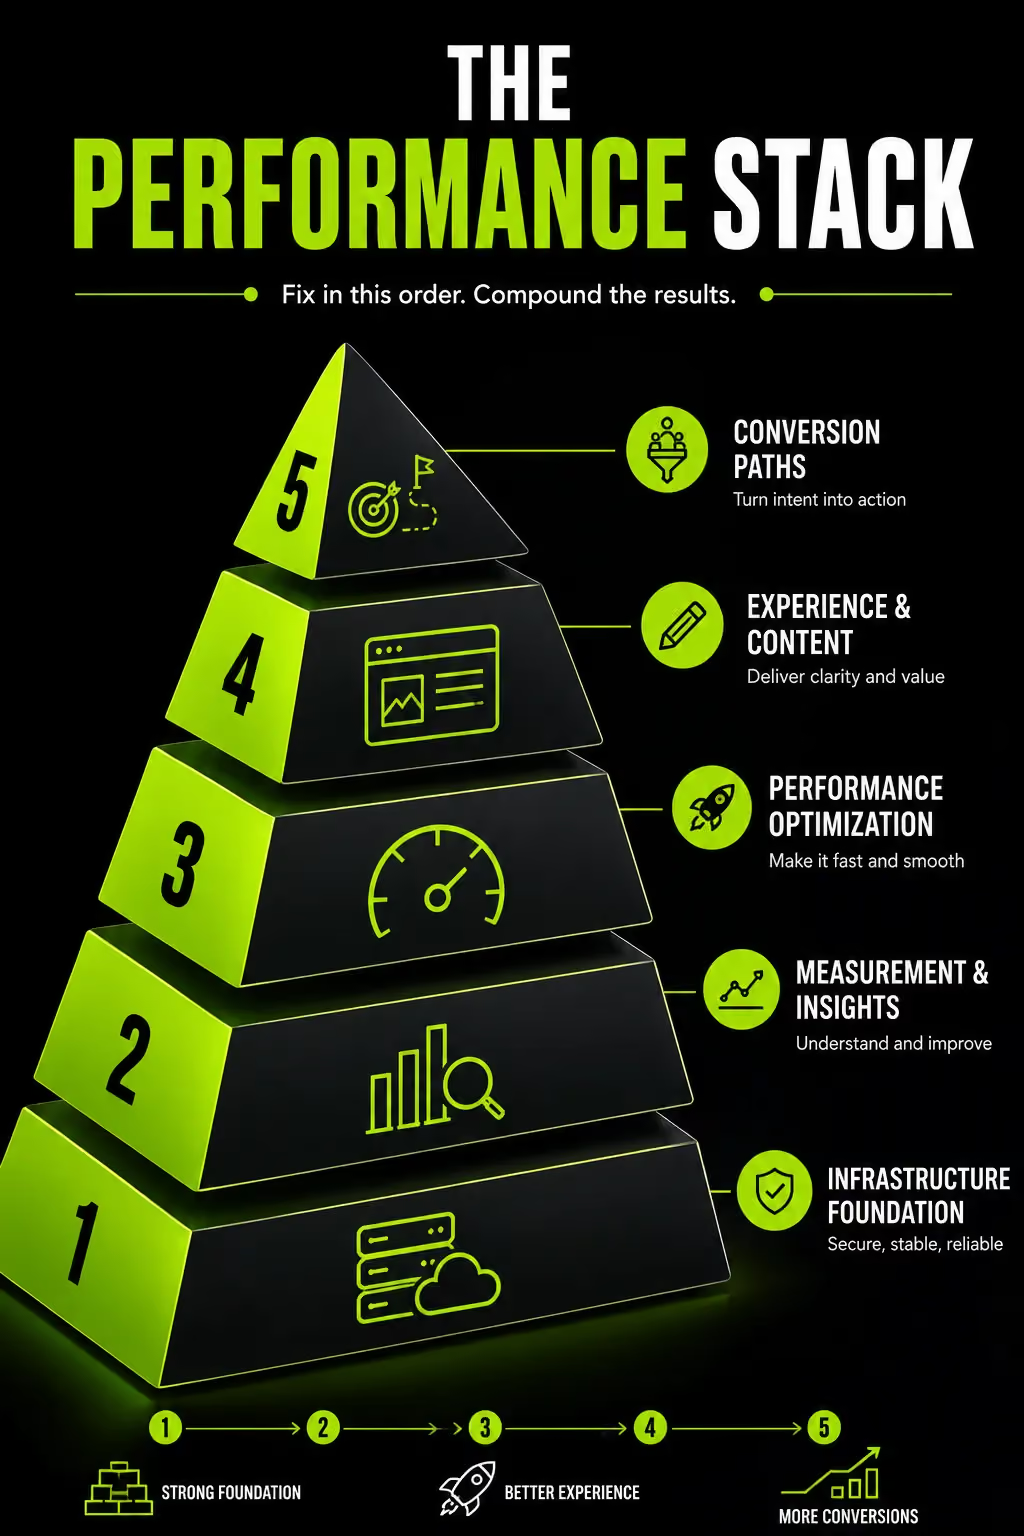
The reason individual performance fixes often fail to move business metrics is that performance is a layered system. A fix at one layer delivers limited return if the layer beneath it is not sound.
The five layers of ecommerce performance the Performance Stack:
Fixing Layer 2 without fixing Layer 1 is architecturally similar to repainting a car with a broken engine.
Image compression on a store with a 1.8-second server response time will not push LCP under 2.5 seconds regardless of how aggressively you compress. Infrastructure sets the ceiling. Everything above it operates within that ceiling.
Core Web Vitals: What They Actually Mean for Ecommerce Revenue
Google's Core Web Vitals are not a ranking technicality. For ecommerce, they are leading indicators of commercial performance, each one measuring a dimension of the user experience that directly predicts whether a visitor buys or leaves.
Only 39% of ecommerce websites pass all three Core Web Vitals simultaneously (HTTPArchive, 2025) three percentage points below the global web average.
Ecommerce sites underperform structurally because product catalog pages are heavier than typical web pages: large images, JavaScript-heavy filtering, third-party review widgets, live inventory checks, and pricing scripts all run simultaneously.
LCP (Largest Contentful Paint): Your Hero Image Is Costing You Sales
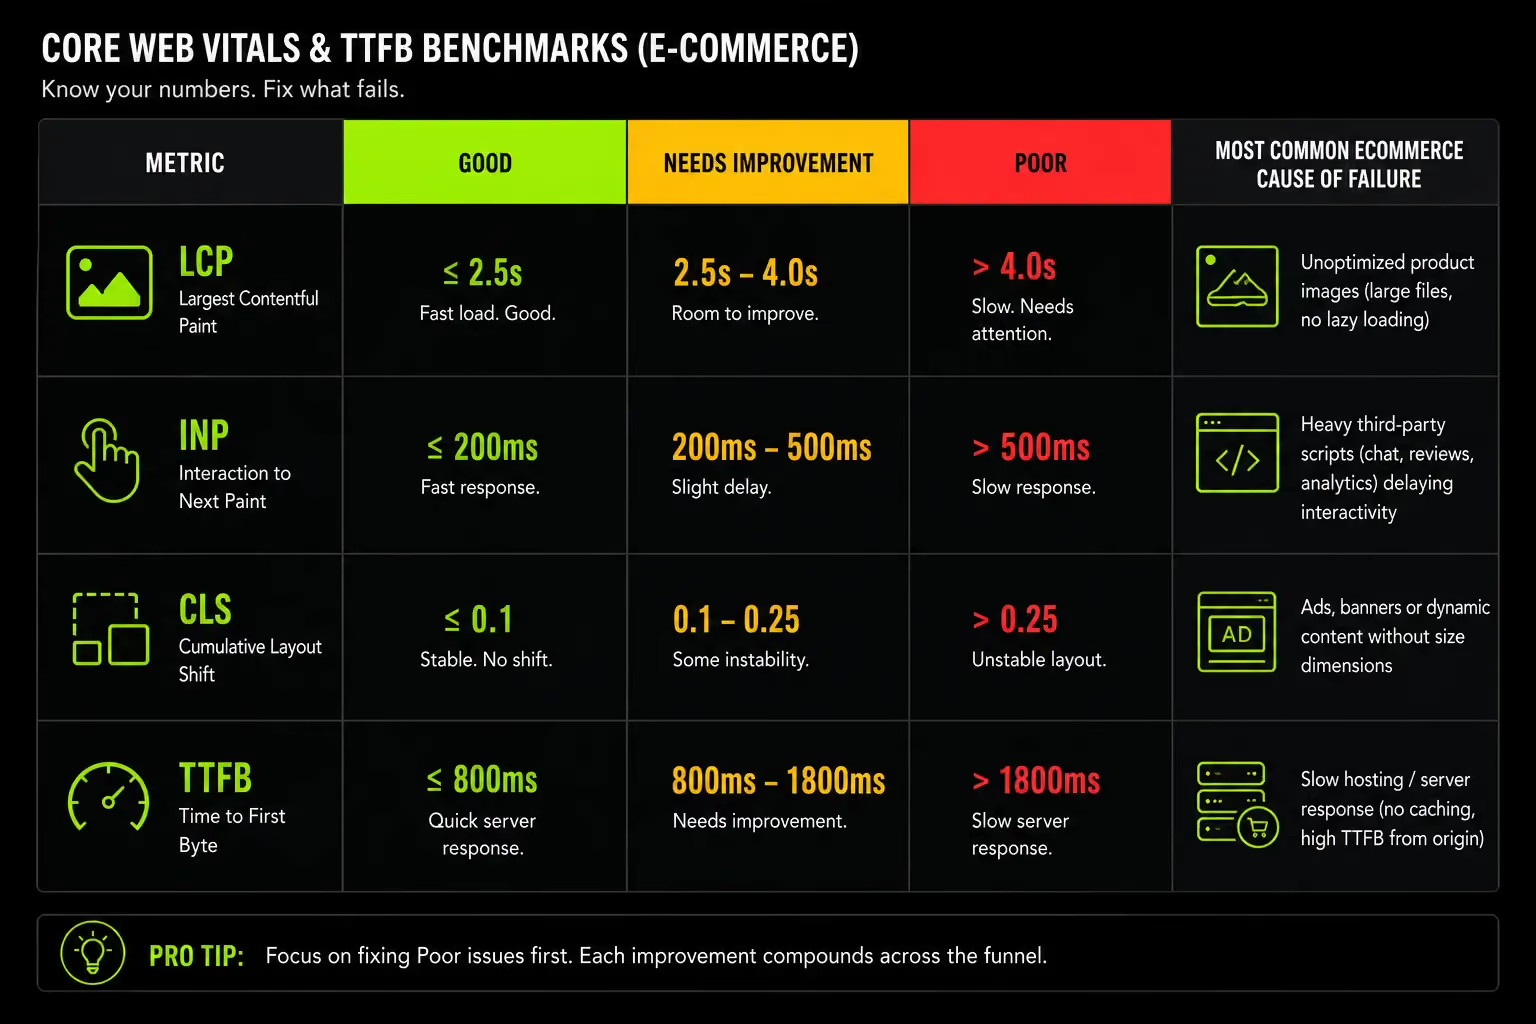
LCP measures the time from page navigation to when the largest visible element fully renders. On an ecommerce product page, that element is almost always the main product image.
On a homepage, it is the hero banner. Good LCP is 2.5 seconds or under. Most unoptimized ecommerce stores sit between 3.5 and 6 seconds on mobile.
The commercial consequence is direct. Renault found a strong, statistically significant correlation between LCP improvements and conversion rate across 10 million visits.
NDTV achieved a 55% bounce rate reduction after improving LCP from 3 seconds to 1.6 seconds.
Common ecommerce LCP failures: uncompressed hero images served at full upload resolution, render-blocking fonts loaded before the image, and no CDN delivering the image from a geographically proximate edge node.
Practical fix sequence: preload the LCP image with a <link rel="preload"> tag, convert to WebP or AVIF format, serve via CDN, and confirm the image is not lazy-loaded.
INP (Interaction to Next Paint): The Hidden Conversion Killer
INP replaced First Input Delay in March 2024. FID measured only the delay before the browser responded to the first tap.
INP measures response delay on any interaction throughout the entire session: tapping Add to Cart, selecting a size variant, opening a size guide, applying a filter on a collection page. Good INP is 200 milliseconds or under. Poor is above 500ms.
A slow INP does not feel like a slow page. It feels like a broken button. The page appears loaded, the customer taps Add to Cart, and nothing happens for 600 milliseconds.
On mobile, where users expect immediate tactile feedback, that lag communicates malfunction. Users leave not because the page was slow to load, they leave because the site appeared to stop working.
This is particularly damaging on product pages where the add-to-cart interaction is the primary commercial event.
The primary cause of ecommerce stores is a congested main thread from accumulated third-party scripts reviewing widgets, chat tools, loyalty programmes and analytics pixels all competing to execute simultaneously, leaving no bandwidth for user interaction events.
CLS (Cumulative Layout Shift): Why Your Checkout Page Loses Trust
CLS measures unexpected visual movement as a page loads. Good CLS is 0.1 or under. A promotional banner that loads 800ms after the page renders and pushes the product title down.
A price tag that reflows when a font loads. An Add to Cart button that shifts position as a sticky header appears at the exact moment a customer is tapping it.
On product pages, CLS is annoying. On checkout pages, CLS is a trust destroyer. Users misclick. They tap the wrong payment options because the layout shifted under their finger.
Rakuten documented a 33% conversion increase after addressing CLS alongside their full Core Web Vitals optimization and the checkout experience was the primary driver.
The fix for most CLS failures is straightforward: set explicit width and height attributes on all images so the browser reserves space before the image loads, and avoid injecting dynamic content above existing page elements.
TTFB (Time to First Byte): The Invisible Metric That Sets Everything Else Up
TTFB measures how long the browser waits for the first byte of a server response. It is not a Core Web Vital, but it is the ceiling for every metric that follows.
If your server takes 1.8 seconds to respond, your LCP cannot be under 2.5 seconds regardless of how optimized every other element is. TTFB is the mathematical floor beneath all other performance work.
Good TTFB is under 800 milliseconds. TTFB is primarily a hosting and infrastructure problem, not a developer problem. No amount of image compression or JavaScript optimization compensates for a slow server response.
Technical Performance Optimization: What to Fix and in What Order
The sequence of performance fixes determines whether you see compound returns or diminishing ones.
Infrastructure-level improvements raise the ceiling for everything above them. Asset-level improvements on poor infrastructure produce marginal gains regardless of how thoroughly they are executed.
Infrastructure First: Hosting and CDN
Shared hosting is the primary performance bottleneck for growing D2C brands. When traffic spikes during a Ramadan sale, a product launch, or a social media campaign, shared servers buckle under concurrent requests. Server response time spikes. TTFB doubles. Every downstream metric fails as a consequence.
Half of WordPress ecommerce sites fail Core Web Vitals primarily because of poor server response time, not theme or code issues (Hostingstep data). The bottleneck is not the code. It is the infrastructure the code runs on.
A CDN is not optional for brands with regional audiences. For UAE brands targeting both UAE and wider GCC, a CDN routes every request to the nearest edge node reducing TTFB for a visitor in Riyadh by routing them to a Middle East edge rather than a Frankfurt server.
Cloudflare, Fastly and Akamai all have Middle East edge presence. For Shopify stores, Shopify's Fastly-powered CDN handles this at the platform level. For WooCommerce or custom builds, CDN must be explicitly configured.
Image Optimization: The Highest-Leverage Fix for Product-Heavy Stores
Image optimization delivers the highest return for the least engineering effort on any product-heavy ecommerce store. A catalog of 5,000 products with four images per product equals 20,000 images.
A collection page displaying 24 products shows 24 images simultaneously. If each image is 400KB instead of 80KB, that single collection page loads 9.6MB in images over five seconds to transfer on a typical 4G connection before any rendering begins.
Practical image optimization sequence:
- Convert product images to WebP format 25 – 35% smaller than JPEG at equivalent visual quality
- Implement responsive images using srcset so the browser fetches the right size for the device
- Lazy load product images below the fold but never the first visible product image or hero banner. Lazy loading above-the-fold images directly worsens LCP and is one of the most common performance errors in ecommerce themes
- Preload the LCP image explicitly with fetchpriority="high" so the browser treats it as a priority resource
JavaScript Optimization: The Ecommerce Minefield
Ecommerce stores run more JavaScript than almost any other category of website. Product filters, variant selectors, upsell popups, review widgets, live chat, analytics, conversion pixels, loyalty programmes, BNPL widgets every one contributes to JavaScript payload and main thread congestion.
The compounding problem: most brands add these tools one by one, evaluated individually for feature value, with no audit of cumulative performance cost.
A store that added five tools over two years may be running a JavaScript payload that adds 3 – 4 seconds to mobile Time to Interactive with no single tool obviously responsible.
Practical fixes: defer all non-critical scripts so they do not block rendering, remove render-blocking scripts from the <head>, and audit installed apps against the Shopify Web Performance Dashboard event annotation timeline.
Every app installs at least one script. The cumulative effect is visible in the CWV data if you know where to look.
Caching and Browser Performance
Browser caching allows repeat visitors to load your store from local cache rather than making fresh server requests.
For ecommerce, properly configured caching reduces load time for returning customers who have higher conversion rates than new visitors by 40 – 70%.
For Shopify: the platform handles CDN-level caching for static assets. App scripts and theme customizations can bypass Shopify's caching layer, loading fresh on every visit.
For WooCommerce and custom-built stores: caching must be configured at the server level using Redis, Varnish, or managed caching, in addition to CDN caching.
Mobile Performance Optimization: The Non-Negotiable for Modern Ecommerce
In the UAE in 2025, 96.4% of the population owns a smartphone. Over 78% of ecommerce orders are placed on mobile.
Cart abandonment in the UAE declined from 22% in 2023 to 14% in 2025 as mobile checkout experiences improved a direct, measurable outcome of mobile performance investment at scale.
A slow mobile experience is not a UX inconvenience. It is a commercial liability affecting the majority of your revenue-generating sessions every single day.
Why Mobile Performance Is Harder Than Desktop Performance
Mobile devices run the same JavaScript as desktop but with slower processors, limited RAM, and variable network conditions that can switch between 4G and 5G mid-session.
A script that executes in 80ms on a MacBook may take 400ms on a mid-range Android device. That difference is the gap between an INP score of "Good" and "Poor."
In the UAE market, iOS devices constitute over 70% of high-value shoppers. iOS Safari applies Intelligent Tracking Prevention (ITP) aggressively, which affects analytics attribution accuracy meaning mobile underperformance in the UAE may be systematically underreported in conversion data if attribution is broken by ITP.
Poor mobile performance may be costing more than your analytics currently show.
Mobile Performance Fixes Specific to Ecommerce
- Font loading: Custom brand fonts add render-blocking network requests. Use font-display: swap to prevent fonts from blocking rendering, and limit custom font variants to the weights your design actually uses.
- Touch target sizing: Buttons sized for mouse clicks are too small for thumbs. The WCAG standard is 44x44px minimum applied directly to Add to Cart buttons, size selectors, and checkout CTAs. Small touch targets increase tap errors, which increases INP event count and user frustration simultaneously.
- Mobile navigation: Hamburger menus with JavaScript-driven animation are a consistent INP contributor. The animation fires on every tap, blocking the main thread. CSS-driven transitions are faster and more reliable.
- Layout shifts on product pages: Sticky headers that appear after scroll, promotional banners injected dynamically, and size guides loading asynchronously all cause CLS on mobile where the viewport is smaller and layout shifts are proportionally more disruptive.
Testing Mobile Performance Accurately
Testing on a flagship phone on office Wi-Fi does not reflect your customers' experience. Use Chrome DevTools with network throttling set to "Fast 3G" or "Slow 4G." Test on actual mid-range Android devices the median device used to browse ecommerce in the GCC is not a flagship handset.
For field data: Google Search Console's Core Web Vitals report shows real-user CrUX data per URL, the data that determines your Google ranking and reflects what actual visitors experience. This is the authoritative performance signal, not a simulation.
Checkout Performance Optimization: The Stage That Determines Revenue
Checkout is where every performance failure is most expensive. A 2-second delay on your homepage costs you a browsing session.
A 2-second delay at payment costs you a sale the customer had already decided to make. Most performance guides treat checkout as an afterthought. It is the most commercially critical performance surface on your entire store.
Why Checkout Pages Are Uniquely Vulnerable
Checkout pages load third-party scripts that do not appear anywhere else: payment processors (Stripe, PayPal, Tabby, Tamara), fraud prevention and 3DS verification scripts, address validation APIs and risk assessment tools. Each adds latency.
Combined, they can add 2 – 4 seconds to checkout page load time on a clean network.
The genuine tension: the more payment options you offer, the more scripts you load. Adding Tabby and Tamara alongside Stripe and Apple Pay covers the UAE consumer expectation for BNPL and adds four distinct third-party script loads.
This is not a reason to reduce payment options. It is a reason to implement them architecturally loading asynchronously so they do not block the checkout page from rendering.
Payment Loading Optimization
The most effective checkout performance fix is preloading payment provider scripts on the cart page, not the checkout page.
When a user is reviewing their cart, their browser silently fetches the Stripe or Tabby script in the background. By the time they click "Proceed to Checkout," the script is already in cache. The checkout page loads as if the payment provider is native.
For UAE stores: Tabby and Tamara both offer asynchronous loading options. Implement them this way. A synchronously loaded BNPL widget that adds 1.2 seconds to checkout rendering is a performance problem with a straightforward architectural solution.
Tokenized payment methods Apple Pay and Google Pay reduce both form complexity and payment gateway loading time. A customer who pays with Apple Pay skips card entry entirely and authenticates with Face ID.
This reduces checkout time, reduces CLS from dynamic form elements, and improves conversion particularly for repeat mobile buyers. UAE Pass integration has been documented to lift first-time checkout conversion by up to 40% for brands that implemented it correctly.
One-Page vs. Multi-Step Checkout: The Performance Angle
Multi-step checkout distributes JavaScript payload across multiple pages, each individual step lighter to load than a comprehensive one-page checkout.
One-page checkout reduces friction and has strong UX evidence for higher conversion but requires careful JavaScript management to prevent INP failures when users interact with form fields.
The answer is not format-dependent. It is script management dependent. Either format performs well when implemented correctly. Either format fails when script debt accumulates without architectural governance.
Form Performance and Autofill
autocomplete attributes on form fields allow browsers to autofill name, address, email, and card details from saved data. For returning customers on mobile, this reduces checkout completion time by 30 – 60 seconds.
That speed improvement directly increases checkout completion rates at no development cost beyond proper attribute tagging.
UAE-specific consideration: UAE postal addressing does not use zip codes. Checkout forms designed for Western postal systems that enforce a postcode field create friction for UAE buyers.
A form that validates against a UK or US address format and rejects a UAE address is a conversion-killing bug that performance optimization alone cannot solve. Address field design for UAE must accommodate governorate-level addressing rather than postcode-based systems.
Third-Party Scripts: The Silent Performance Tax
Every marketing, analytics, and engagement tool an ecommerce brand installs is a performance trade-off. The business team evaluates tools by feature set. The engineering team installs them. Nobody audits the cumulative performance cost.
Over two or three years, the result is script debt, a collection of third-party calls that add 3 – 6 seconds to page load and 300 – 600ms to INP, with no single tool responsible enough to create an obvious removal case.
What Counts as a Third-Party Script (and How Heavy They Are)
Every one of these loads external JavaScript on your store pages:
- Live chat widgets (Intercom, Tidio, Gorgias): 80 – 200KB of JavaScript, loaded on every page regardless of whether the user opens the chat
- Analytics tools (GA4, Hotjar, Microsoft Clarity): necessary, but each adds event listeners competing for the main thread
- Marketing pixels (Meta, TikTok, Snapchat): critical for UAE brands running social commerce campaigns, but each pixel fires multiple requests per page load
- Review apps (Yotpo, Okendo, Stamped): add JavaScript weight plus additional network requests for review data per product
- Loyalty and referral programmes: inject UI elements that contribute to CLS if not implemented carefully
- BNPL widgets (Tabby, Tamara): must be loaded asynchronously for UAE market performance
- Pop-up and email capture tools: frequently the highest CLS contributors due to overlay injection timing
How to Audit Your Script Load
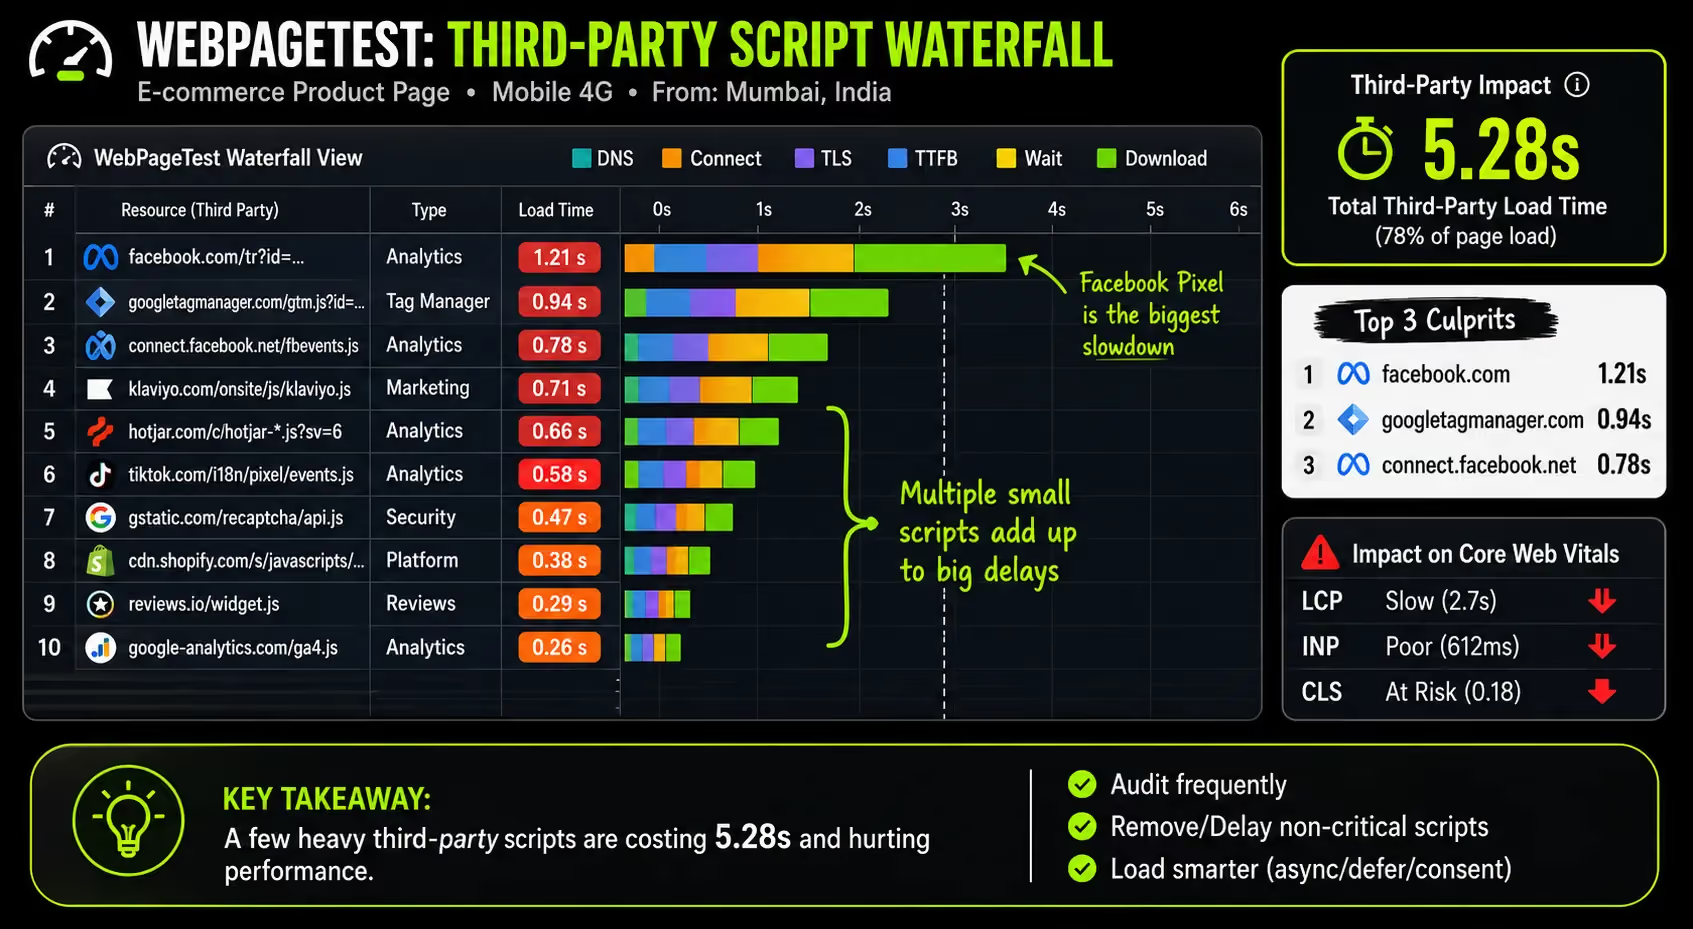
Open Chrome DevTools, go to the Network tab, filter by script type, and reload the page. The waterfall view shows which scripts are blocking rendering and which are loading other scripts. A script that loads other scripts multiplies the performance cost non-linearly.
WebPageTest's third-party waterfall report labels each request by domain and shows its contribution to total load time. RequestMap visualises the full dependency graph.
The Script Audit Matrix: for each third-party tool, assign a Business Value Score (1 – 5) based on its contribution to revenue or operations and a Performance Cost Score (1 – 5) based on measured impact on LCP and INP.
Any tool where Performance Cost exceeds Business Value is a removal or replacement candidate. This is how engineering-mature D2C brands govern their stack not by blocking all tools, but by maintaining explicit accountability for each addition.
Performance Budget for Ecommerce
A performance budget is a defined threshold LCP must remain under 2.5 seconds that governs whether a new tool can be added. If adding a loyalty widget would push LCP from 2.3 seconds to 2.8 seconds, the business case for the widget must justify crossing that threshold. This prevents the gradual accumulation of script debt that characterises most ecommerce stores' performance histories.
Measuring and Prioritizing Performance: A Framework for Decision-Makers
Most brands measure performance once usually when something breaks and fix whatever the tool highlights first. That is reactive maintenance, not performance strategy. Performance optimization should be a continuous loop tied to commercial outcomes.
The Right Metrics to Track (and Why PageSpeed Score Is Not One of Them)
CrUX field data is what Google uses for ranking and what reflects actual user experience. The tools to use:
- Google Search Console Core Web Vitals report: Field data surfaced directly against your URL set, segmented by mobile and desktop. The only tool that shows exactly which pages are failing and what Google's view of your ranking signals looks like.
- Revenue-correlated metrics in GA4: Segment conversion rate by page load time quartile. This shows directly what revenue is being lost per additional second of load time on your specific store, with your specific audience a commercial case for performance investment that finance and leadership can act on.
- Bounce rate by page speed: The gap between fast-session and slow-session bounce rates is your performance revenue opportunity in measurable, CFO-legible terms.
What a Proper Ecommerce Performance Audit Covers
A proper ecommerce performance audit covers all six dimensions:
- Infrastructure: TTFB, server response time, CDN coverage, geographic latency to target markets
- Asset delivery: Image formats, sizes, and delivery method across all page types
- Rendering: JavaScript bundle size, unused code percentage, render-blocking resource count
- Third-party impact: Waterfall analysis of external scripts with Business Value versus Performance Cost assessment
- Mobile-specific: CrUX mobile field data segmented by page type
- Checkout-specific: Separate audit of the full payment flow
- Business correlation: Conversion rate segmented by load time the commercial translation of technical findings
Prioritization: Impact vs. Effort Matrix
Start in the top-left. High-impact, low-effort fixes deliver the fastest return and build the commercial case for the larger architectural investments in the top-right.
How We Approach Performance Optimization at Suplex
At Suplex, performance optimization starts with business metrics, not PageSpeed scores. We analyze conversion rates by device, mobile revenue per visitor, session drop-offs and checkout friction before touching technical audits. Better scores alone do not improve revenue. Better customer experience does.
Our Performance Stack follows a strict sequence. Infrastructure issues are solved before frontend optimizations because weak hosting, app overload, and poor architecture limit every layer above them.
Across Shopify audits in the UAE, India, and global D2C markets, the biggest bottleneck is usually theme and app debt, not Shopify itself.
We also treat checkout optimization as a separate workstream. A fast store with checkout friction will still lose revenue. Mobile usability and speed must work together.
This approach has been applied across D2C brands including Miduty, Kooji and Bigtoe, where the highest ROI consistently came from checkout performance and third-party script governance, not homepage speed alone.
If your store is failing Core Web Vitals, Suplex translates those technical issues into commercial impact, starting with the business data first.
Ecommerce Performance Optimization by Platform
Performance constraints and solutions differ by platform. The fixes that move the needle on Shopify are different from WooCommerce, and different again on a headless architecture.
Shopify Performance Optimization
Shopify's global CDN handles Layer 1 well. TTFB is generally strong on Shopify's infrastructure.
The performance problems on Shopify stores are concentrated at Layers 2 and 3 asset delivery and rendering and are almost entirely caused by theme and app decisions, not platform limitations.
Common Shopify performance killers: too many installed apps (each adds at least one script to every page load), unoptimized theme customizations on Dawn or other Shopify 2.0 bases that introduce render-blocking code, YouTube or Vimeo embeds placed above the fold on homepage sections, and Google Fonts loaded synchronously.
Shopify 2.0 themes with section-based architecture improve default performance versus legacy themes but only when implemented correctly.
A 2.0 theme with 12 apps installed performs worse than a well-maintained legacy theme with three. The architecture matters less than the governance applied to it.
WooCommerce and WordPress Performance Optimization
Hosting is the primary variable on WordPress. WordPress on shared hosting fails Core Web Vitals almost universally not because of WordPress itself, but because shared hosting cannot deliver TTFB under 800ms under real traffic conditions.
The required stack for a performant WooCommerce store: edge-caching managed hosting (Kinsta, WP Engine, or Cloudways), Redis object caching to reduce database query time, an image CDN (Cloudflare or BunnyCDN) and aggressive plugin audit to eliminate script debt.
WordPress can technically outperform Shopify on raw speed metrics when properly engineered but it requires significantly more ongoing infrastructure management and maintenance discipline than a SaaS platform.
Headless and Custom Ecommerce Performance
Headless architecture separates the frontend from the commerce backend, enabling maximum performance control.
A Next.js frontend with edge rendering and static generation can achieve near-perfect Core Web Vitals LCP under 1.5 seconds on mobile, INP under 100ms, CLS at zero because the developer controls every rendering decision without platform constraints.
The trade-off is development cost and ongoing complexity. Headless is the right architectural choice for high-volume D2C brands with complex UX requirements, international multi-language stores or brands where the performance ceiling of a SaaS platform is genuinely limiting commercial outcomes.
It is not the right choice for early-stage brands where the infrastructure investment outweighs the performance return.
Frequently Asked Questions
How do I improve ecommerce site performance?
Starting with infrastructure, your server response time sets the ceiling for every other metric. Then address image optimization, the highest-leverage asset-level fix for product-heavy stores. Eliminate unused JavaScript and audit third-party scripts for cumulative performance cost. Fix in that sequence infrastructure, assets, rendering, scripts and each step compounds the previous one. Fixing them in random order produces marginal gains.
What is a good page load time for an ecommerce website?
Target LCP under 2.5 seconds on mobile as measured by real user field data not a PageSpeed Insights lab score. Load times above 3 seconds significantly increase bounce rates, with mobile users least tolerant. For checkout pages specifically, under 2 seconds is achievable and commercially important delays at checkout cost sales that were already decided by the customer.
Does website speed affect ecommerce conversion rates?
Yes directly and measurably. A 1-second improvement in LCP can increase conversions by 4 – 8% depending on baseline and category. Rakuten documented a 33% conversion increase after full Core Web Vitals optimization. Vodafone saw an 8% sales increase from a 31% LCP improvement. The relationship is strongest on mobile, where users are less patient and networks are less predictable.
What are Core Web Vitals and why do they matter for ecommerce?
Core Web Vitals are three Google-defined metrics: LCP (how fast the main content loads), INP (how fast the page responds to user interaction), and CLS (how stable the layout is while loading). Failing any one of them affects both Google rankings and user behaviour directly. Only 39% of ecommerce sites currently pass all three meaning most stores are losing organic traffic and revenue to faster competitors.
Hi, I’m Rishabh Jain
I believe great digital experiences have the power to shape perception, build trust, and move businesses forward. That belief led me to found Suplex Design Studio, a global digital design and development studio helping FMCG and D2C brands build websites and digital experiences that are strategic, thoughtful, and commercially meaningful.
I started Suplex at 25 with a clear intent, to create digital experiences that look appealing, work seamlessly, and help D2C businesses grow. By 28, the studio had scaled globally, guided by a strong foundation in integrated design that I developed during my academic journey in London, where I was honoured with the Dean’s Award.
Over the years, I’ve had the opportunity to work with 100+ brands, from Fortune 500 organisations to family-run businesses, helping them build websites, e-commerce experiences, and digital products that create clarity, credibility, and long-term value.
Our work has been recognised internationally, including the Manifest Award (2024), the Clutch Global Award (2025), and features across platforms such as The Dieline, Packaging of the World, and the World Brand Design Society.
None of this would be possible without the people behind the work. I’m deeply grateful to the Suplex team, whose commitment, creativity, and attention to detail turn ideas into meaningful digital experiences every day.
At the heart of our work is a simple philosophy, digital design should be intentional, functional, and built to create real business value. That continues to guide everything we create at Suplex.





































Let’s Make It Happen
E-Commerce Success Stories

%201.avif)






.avif)

.avif)
Build Your D2C Business The Right Way
Build It With Suplex.


