Shopify Web Performance Dashboard: A Complete Guide for Store Owners
.avif)
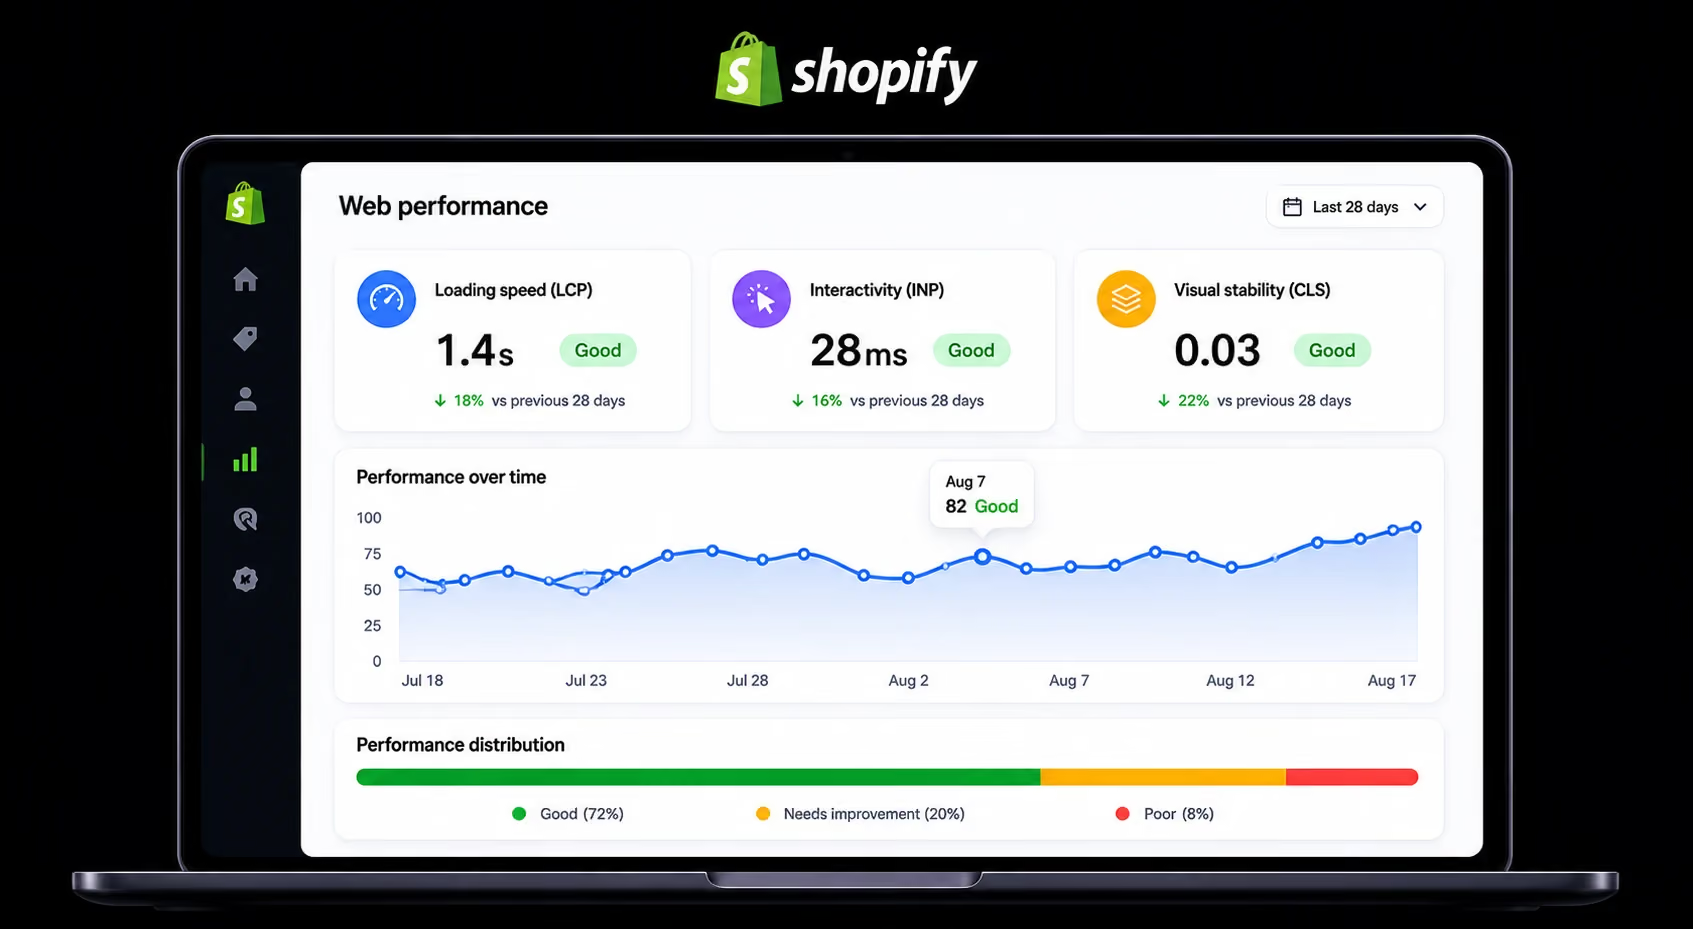
Shopify Web Performance Dashboard: A Complete Guide for Store Owners
Most Shopify store owners either ignore their performance data entirely or check the wrong numbers and act on the wrong signals.
The Shopify Web Performance Dashboard launched in January 2024 is the most important analytics tool your store has access to and it is built in, free and pulling from real shopper data.
It tracks the three Core Web Vitals that Google uses to rank your store in search: LCP (loading speed), INP (interactivity) and CLS (visual stability).
This blog explains exactly what the dashboard measures, how to read it, how to act on it, and how to use it to trace performance problems to their root cause before they compound into ranking drops and lost revenue.
What Is the Shopify Web Performance Dashboard?
The Shopify Web Performance Dashboard is a built-in performance reporting tool available to all Liquid storefront merchants. It is not part of Shopify's broader Analytics section. It is not a sales report.
It is specifically a frontend experience monitoring tool built to show you how real shoppers experience your store's speed and interactivity, and to give you the data Google uses when ranking your pages.
Understanding this distinction matters immediately. Many merchants open it expecting to see traffic or revenue data, find it unfamiliar, and close it. That is a mistake that compounds quietly over weeks.
Lab Data vs. Field Data: Why the Old Speed Score Was Misleading
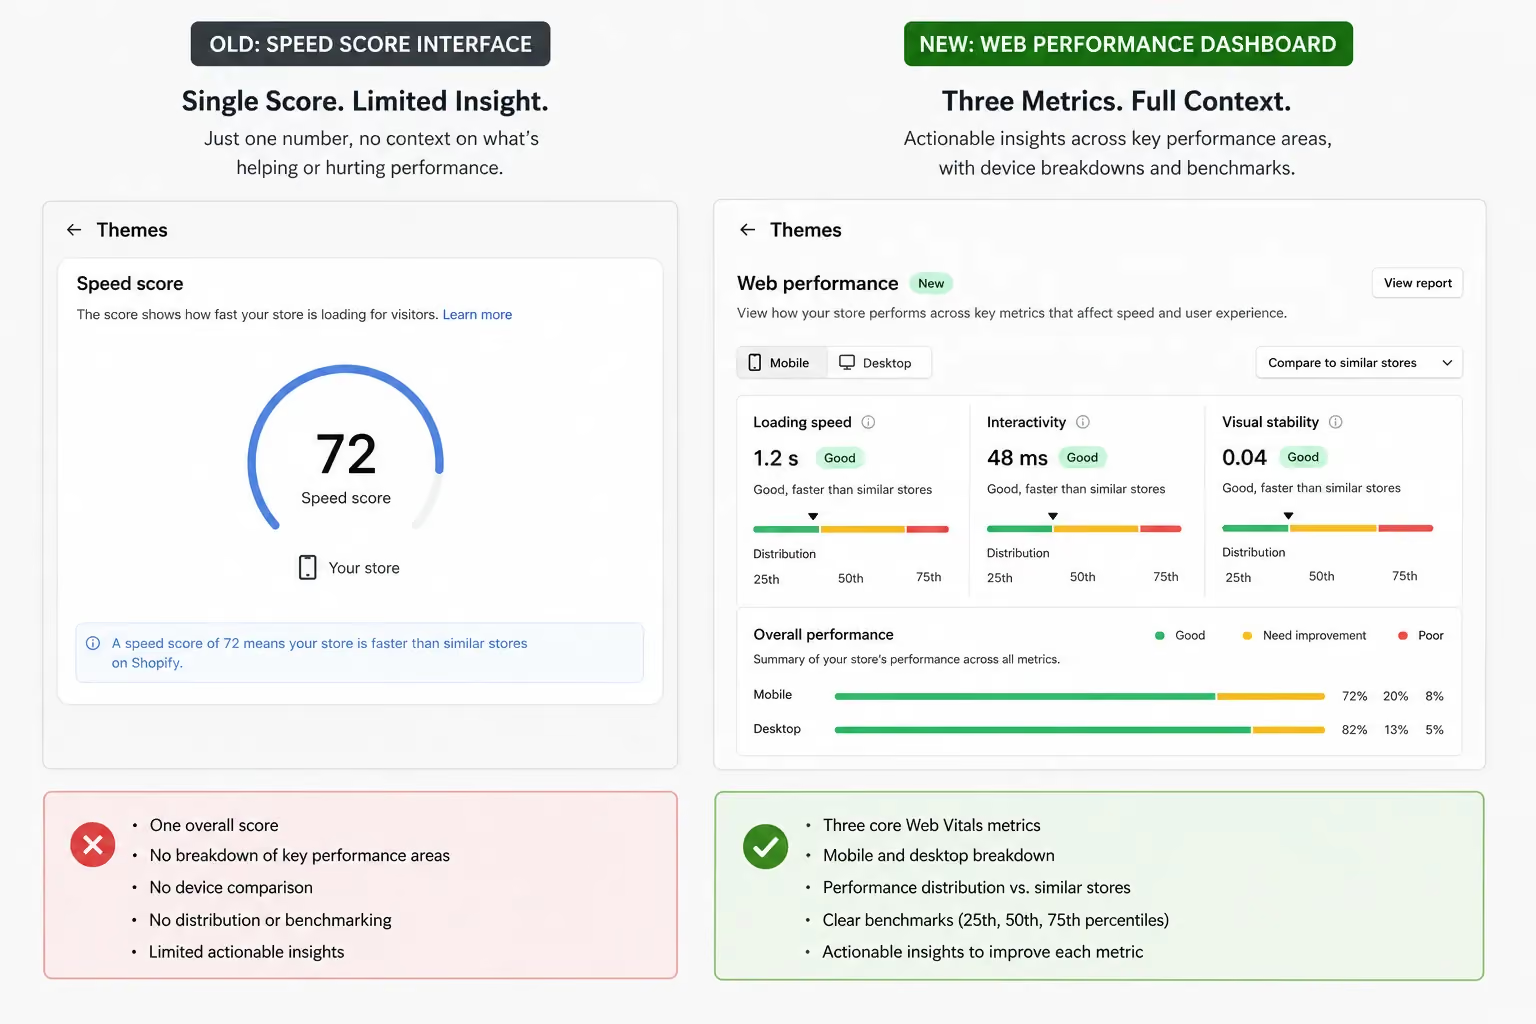
The previous Shopify Speed Score was a single number produced by a Lighthouse simulation, a synthetic test run in a controlled lab environment on a simulated device and network.
It did not reflect what your actual customers experienced. It did not account for the combination of apps, scripts, and real-world network conditions your shoppers dealt with on their phones.
The Web Performance Dashboard uses Real User Metrics (RUM) data collected from actual Chrome browser sessions by real visitors to your store. This is field data, and it is categorically more accurate.
It is also, specifically, the same data source Google's ranking algorithm draws from via the Chrome User Experience Report (CrUX). When you improve your dashboard scores, you are improving the signal Google uses to rank your pages.
What You Need to Know Before You Open It
- Launched: January 31, 2024 available to all Liquid storefront merchants at no cost
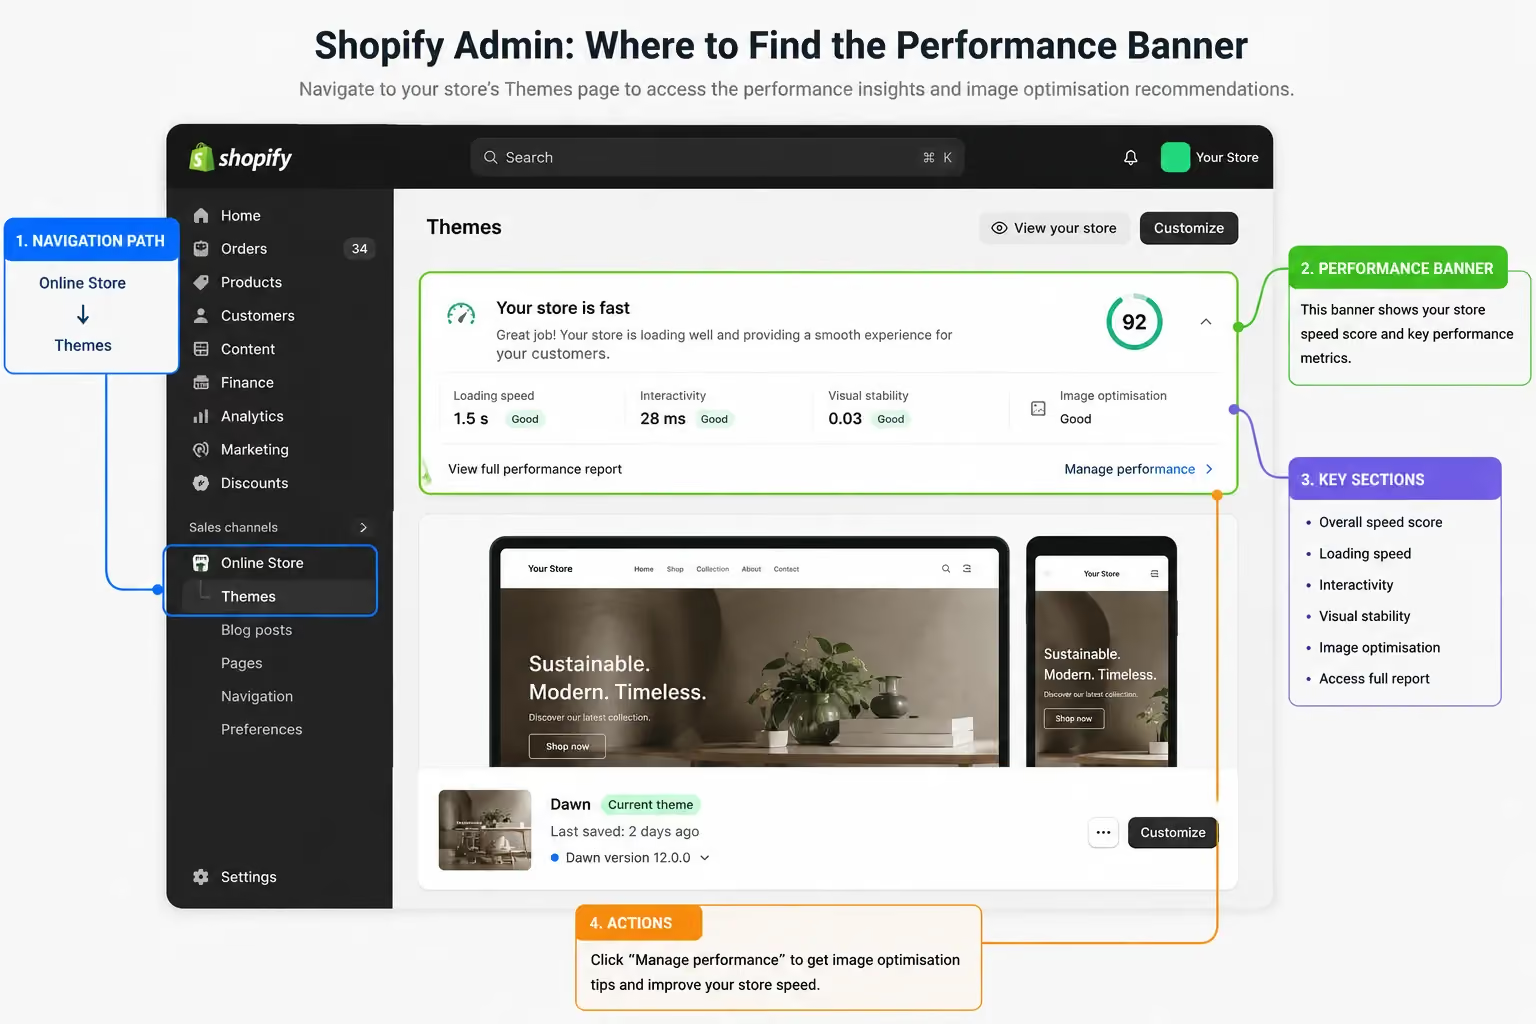
- Location: Shopify Admin → Online Store → Themes → performance banner at the top of the page. Also accessible via Analytics → Reports → Web Performance
- Access: Available to store owners, staff with Reports permission, and Shopify Partners
- Data requirement: Password protection must be removed for data to populate. RUM requires real visitor traffic.
- Data delay: Updates with up to a 36-hour delay. It is not a real-time tool.
Why This Dashboard Matters More Than Your PageSpeed Score
Running Google PageSpeed Insights on your store URL and acting on that number alone is one of the most common and most costly performance optimization mistakes Shopify merchants make.
PageSpeed Insights gives you useful diagnostic data. It does not give you your ranking signal.
Google Uses the 75th Percentile of Real User Data
Google's ranking algorithm evaluates Core Web Vitals at the 75th percentile from real Chrome user sessions. This means your performance score is not set by your average user or your best user it is set by your slowest 25%.
If a quarter of your visitors experience poor load times, that experience determines your ranking position, regardless of how fast the other 75% are.
This has a direct implication for how you read the dashboard. The distribution bar showing the percentage of your users in Good, Needs Improvement, and Poor matters more than the headline score. A store with an average LCP of 2.3 seconds but 30% of users in the "Poor" bucket has a serious ranking and conversion problem that the average alone conceals.
Only 48% of Shopify stores pass all three Core Web Vitals on mobile (Shero Commerce, analysis of 1,000 real stores). That means more than half of Shopify stores are leaving ranking performance on the table.
The broader picture is more encouraging: 75.22% of Shopify websites pass Core Web Vitals overall, compared to WordPress at 43.44% (Search Engine Journal, 2025) but mobile, which is where Google ranks you, tells a different story.
Mobile-First Indexing Changes Everything
Google indexes and ranks your store based on its mobile experience. Your desktop score is secondary.
Mobile Core Web Vitals scores are typically 40 – 60% worse than desktop on the same store because mobile devices have slower processors, variable network connections, and less memory available to render JavaScript.
For UAE and Gulf merchants specifically: iOS device penetration is high, and Apple's Safari browser now reports LCP and INP metrics to the Chrome UX Report aggregation pool.
Performance gaps on iOS are no longer invisible. If your store underperforms on Safari mobile, that data is now feeding into your ranking signal.
Every 1-second improvement in mobile page load time increases conversion rates by approximately 7% (Google and Deloitte research). That relationship is not theoretical; it is consistent across ecommerce categories and traffic volumes.
The Three Core Web Vitals: What Each Score Actually Tells You
LCP, INP, and CLS are not interchangeable. Each measures a different dimension of the user experience, fails for different reasons on Shopify specifically, and has a different commercial impact when it goes wrong.
LCP (Largest Contentful Paint): Loading Speed
LCP measures the time from when a user navigates to a page to when the largest visible element fully renders. On a Shopify product page, that element is almost always the main product image. On a homepage, it is almost always the hero banner.
- Good: 2.5 seconds or under
- Needs Improvement: 2.5 – 4.0 seconds
- Poor: above 4.0 seconds
The median mobile LCP across Shopify stores sits at approximately 2.26 seconds close enough to the 2.5-second threshold that a single unoptimised image or one extra app script pushes many stores into the "Needs Improvement" range.
Stores running eight or more third-party app scripts show a median mobile LCP above 3.0 seconds.
LCP is where the overwhelming majority of Shopify Core Web Vitals failures occur. If your dashboard shows one failing metric, it is almost certainly this one.
INP (Interaction to Next Paint): Interactivity
INP replaced First Input Delay (FID) in March 2024. The upgrade matters: FID only measured the delay before the browser responded to the first tap.
INP measures the delay on any interaction throughout the entire session tapping a colour swatch, selecting a size, pressing Add to Cart, opening a dropdown.
- Good: 200ms or under
- Poor: above 500ms
A slow INP score means your store feels unresponsive. The product image loaded. The price is visible. The customer taps Add to Cart and nothing happens for half a second.
That lag is enough friction to cause abandonment, particularly on mobile where users expect immediate tactile feedback.
The primary cause of Shopify is a congested main thread accumulated in JavaScript from review widgets, chat apps, loyalty programmes and tracking pixels all competing to execute simultaneously.
Each individual app may seem harmless. Combined, they block the browser from responding to user input.
CLS (Cumulative Layout Shift): Visual Stability
CLS measures unexpected visual movement as a page loads. Banners that jump down when a font loads, buttons that shift when an image appears, content that reflows when a late-loading script injects an element all of these increase the CLS score.
- Good: 0.1 or under
- Poor: above 0.25
Shopify's median CLS is approximately 0.01; this is where Shopify stores consistently perform well, largely because Shopify's themes set image dimensions correctly by default.
CLS failures on Shopify are usually caused by images without explicit dimensions in legacy or heavily modified themes, late-loading custom fonts, or dynamically injected promotional banners from third-party apps.
How to Read the Shopify Web Performance Dashboard: A Step-by-Step Walkthrough
Most merchants open this dashboard, see a line graph and some colour-coded labels, and close it without taking any action. This section walks through exactly what each element means and how to configure the dashboard so the data it shows is actually useful.
How to Access the Dashboard
Two paths: Shopify Admin → Online Store → Themes the performance summary banner is at the top of the Themes page.
Click it to open the full dashboard. Or: Analytics → Reports → Web Performance section.
The second path is useful when you want to access performance data directly from your analytics workflow without navigating through Themes.
Understanding the Summary Score and Graph
The summary score reflects your Core Web Vitals status across the selected date range, not a real-time reading. The line chart below it shows each metric's trajectory over time. Changes in the line tell you whether performance is improving, degrading, or stable.
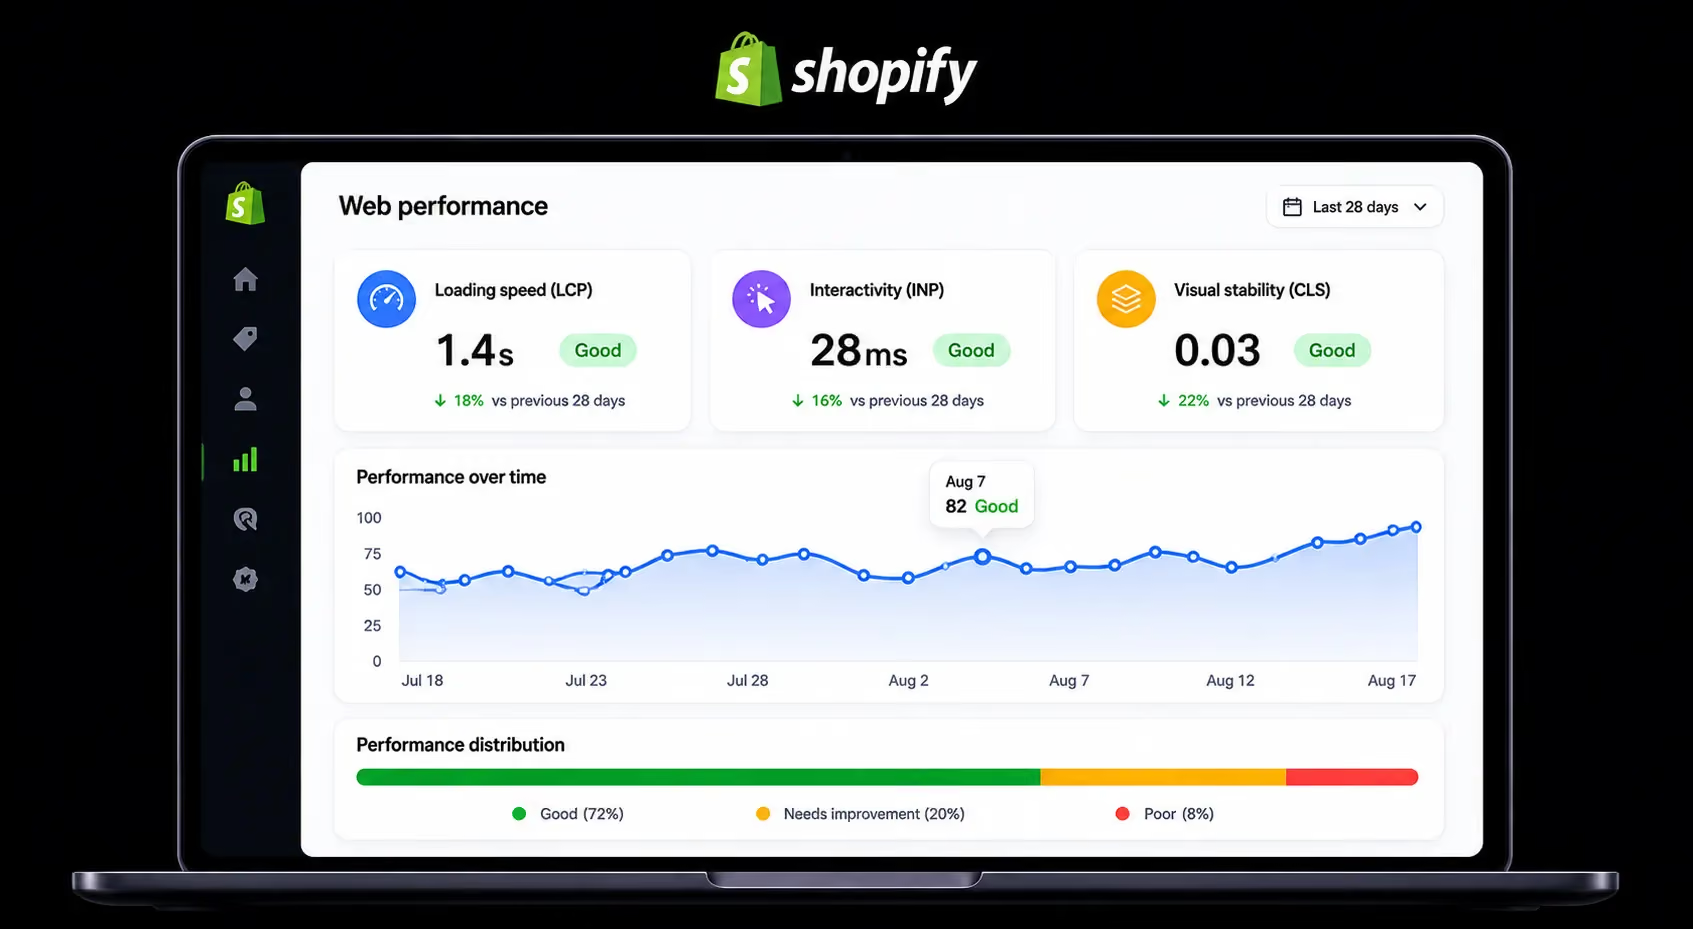
The event annotation tags are the most valuable element on this graph. They appear as numbered vertical lines on the timeline. Each one marks a specific store change: an app installed or uninstalled, a theme published, a code deployment.
Hover over any annotation to see what happened. If you see a performance regression, the nearest annotation before the drop is your starting point for root-cause investigation.
Most merchants scroll past these markers entirely. They represent the difference between knowing performance dropped and knowing why.
Configuring the Dashboard for Actionable Data
The default settings are not optimally configured for decision-making. Adjust these:
- Date range: Extend to 30 – 90 days for trend analysis. The default shows a short window that conceals longer-term patterns.
- Device type: Switch to mobile. Always review mobile separately. The combined view averages mobile and desktop data which masks the mobile underperformance that matters for ranking.
- Page type: Filter by page type Home, Product, Collection. Each has a different performance profile and different root causes when failing. Product pages almost always have the worst LCP.
- 75th percentile: This is the default and the correct view. Do not change it; this is the threshold Google evaluates.
Practical workflow:
- Open mobile data first
- Check LCP the highest failure rate on Shopify
- Identify which page type is failing
- Look at event annotations for any correlation with a recent change
- Use PageSpeed Insights or Chrome DevTools to identify the specific element causing the failure
- Fix, then monitor the dashboard for 2 – 4 weeks to confirm the improvement
What "Good," "Needs Improvement," and "Poor" Mean in Practice
These labels are not aesthetic categories. They map directly to Google's ranking thresholds:
- Good: Your store meets Google's page experience standard for this metric no ranking suppression from this signal
- Needs Improvement: Google considers this a suboptimal experience mobile ranking is likely deprioritised relative to competitors with Good scores
- Poor: Google treats this as a poor page experience meaningful ranking suppression for mobile search results
The distribution bar below the headline label is the number to watch closely. It shows the percentage of your real users in each category.
A headline score of "Needs Improvement" with 5% of users in "Poor" is a very different situation from the same headline with 40% in "Poor." Both look the same at a glance. The distribution bar tells the real story.
Event Annotations: The Most Underused Feature on the Dashboard
Event annotations turn the Shopify Web Performance Dashboard from a passive scorecard into an active diagnostic tool.
Almost nothing in the existing SERP content on this dashboard covers them with any depth. That is a significant gap, because they are the feature that makes the dashboard genuinely useful for root-cause analysis.
What Event Annotations Track
Shopify automatically logs the following events as annotations on the performance timeline:
- App installations and uninstalls
- Theme publishes (new theme going live or an existing theme updated)
- Custom code deployments
- Product events (published, unpublished)
- System events (data delays, metric calculation changes)
Each event appears as a numbered vertical line on the graph. Hovering over the marker shows the event type and timestamp. The correlation between the event and any subsequent change in your LCP, INP, or CLS score is often immediate and clear.
The Before/After Annotation Method
This is the diagnostic process we use at Suplex when a client reports a performance regression they cannot explain:
- Identify the regression the point on the timeline where a score worsened
- Find the nearest annotation marker before the regression date
- Read the event app install, theme publish, code change
- That event is your primary suspect
- Test by removing the app, rolling back the theme, or reverting the code change
- Check the dashboard again after 48 – 72 hours to confirm the score recovers
A practical example: A D2C brand installs a third-party review widget to increase social proof on product pages. The next day, LCP on product pages jumps from 2.1 seconds to 3.4 seconds.
Without event annotations, the team spends weeks testing theme code, image compression, and hosting settings. With the annotation, they identify the review app in 20 minutes, switch to a lighter alternative, and recover the LCP score within a week.
62% of Shopify apps negatively impact performance. Event annotations let you identify precisely which app is responsible and when it started causing the problem.
The Most Common Reasons Shopify Stores Fail Core Web Vitals
Shopify is architecturally different from WordPress or custom platforms. Merchants cannot control the server, CDN, or core Shopify JavaScript. Every performance fix happens at the theme or app layer.
That constraint narrows the problem space considerably and makes diagnosis faster when you know where to look.
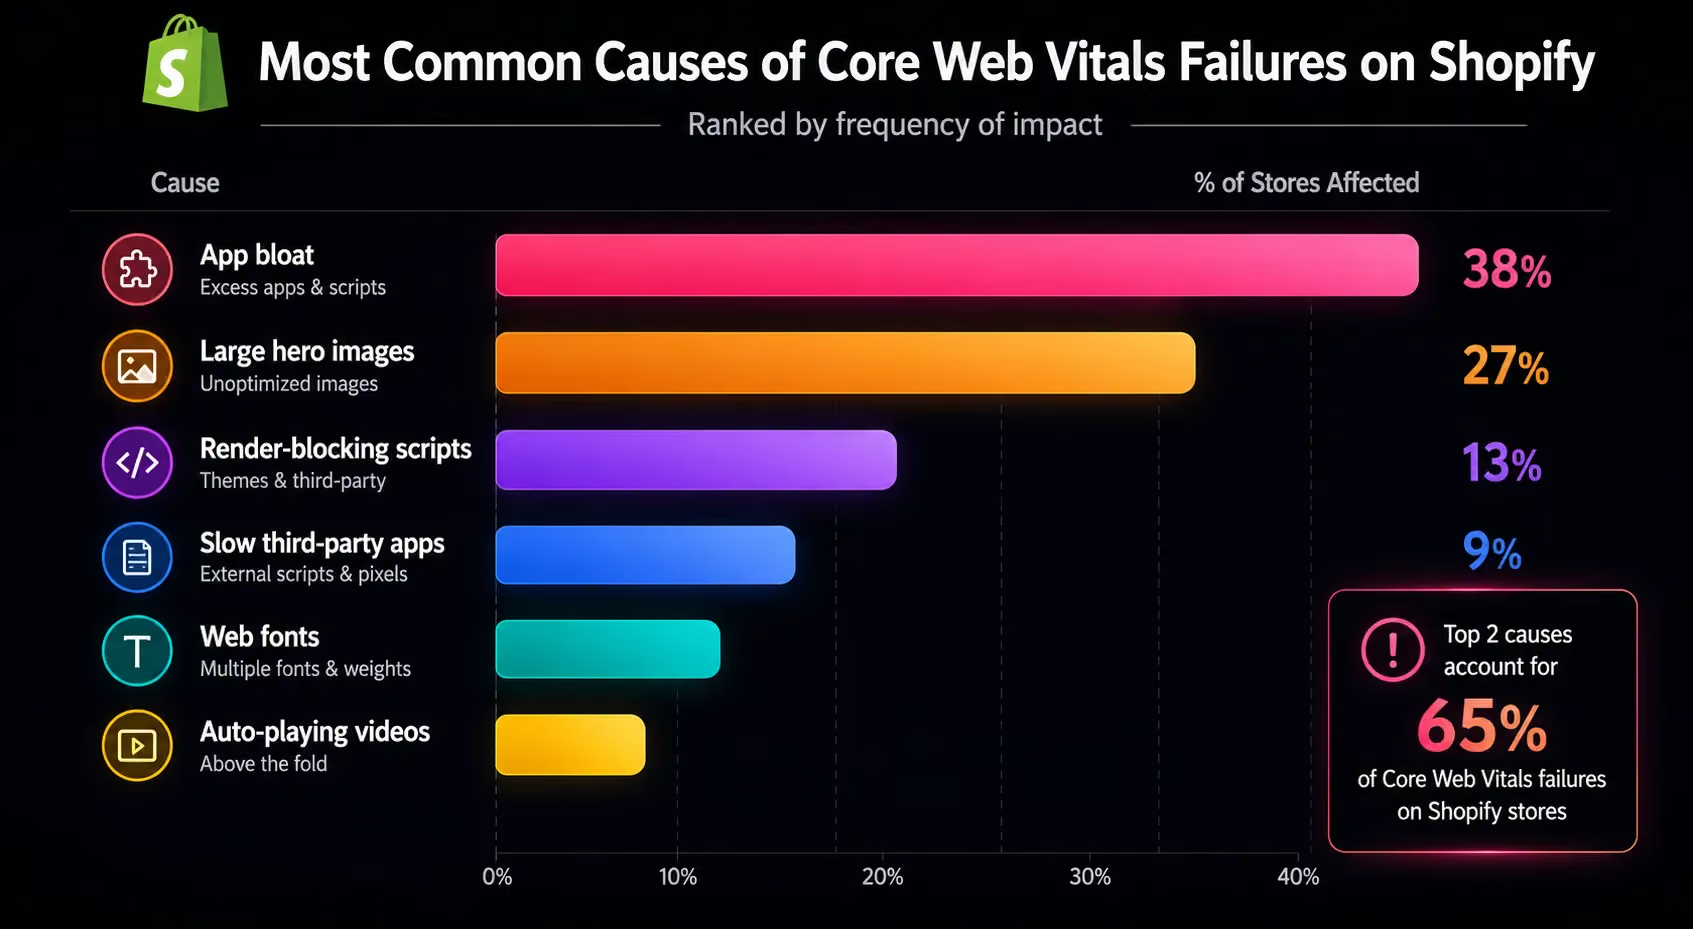
App Bloat: The Primary Culprit
Shopify apps inject JavaScript into your storefront, often loading it on every page whether it’s needed or not. A chat widget meant for the contact page can still load on product pages, and a loyalty app for the account section may run on the homepage.
The bigger issue is leftover “ghost code.” When apps are uninstalled, their scripts often remain in your theme, continuing to load and slow down your site without adding any value.
Stores with eight or more third-party app scripts typically see mobile LCP above 3.0 seconds, and the average Shopify store carries about 251KB of unused JavaScript per mobile page, based on real-world data.
How to identify it on the dashboard:
Look for an LCP or INP regression that correlates directly with an annotation showing an app install. That is your prime suspect. Test by uninstalling the app and checking for ghost scripts in your theme's code.
Unoptimised Hero Images
The hero image is almost always the LCP element on the homepage. An uncompressed hero banner uploaded as a 3MB JPEG without a preload directive forces the browser to discover it late in the page load sequence and then spend significant time fetching it. Both steps delay LCP.
The dashboard's page type filter is useful here: if your homepage has worse LCP than your collection pages, a hero image is almost certainly the cause.
Fix direction: Compress hero images to under 300KB, add explicit dimensions, and implement fetchpriority="high" as a preload hint so the browser prioritises fetching the image immediately.
Third-Party Scripts: Reviews, Chat, Tracking
Review widgets, live chat, loyalty apps, and analytics pixels all contribute to INP degradation by competing for the main thread. They do not prevent the page from loading visually which is why LCP can look acceptable while INP is failing.
The page appears ready. But when a customer taps Add to Cart, the browser is still processing scripts and cannot respond immediately.
The dashboard shows INP per page type. If your product pages have consistently worse INP than your homepage, product-specific scripts review widgets that load on product pages only, for example are the likely cause.
Removing a single unnecessary review widget script has been documented to improve median INP by 45ms in production Shopify stores (CoreDash RUM data).
Theme-Level Issues
Heavy themes with built-in parallax effects, complex JavaScript animations, and redundant feature sets add page weight that compounds with every app script added on top. The theme itself may have been performant at launch, but over time, app additions push it past acceptable thresholds.
Switching themes registers as an event annotation. You can directly measure the before/after LCP, INP, and CLS impact of a theme change against your real user data which is a more reliable evaluation than any theme demo environment provides.
Shopify Web Performance Dashboard vs. Other Tools: When to Use Each
The Shopify Web Performance Dashboard is not a replacement for every performance tool. It answers different questions than PageSpeed Insights, Chrome DevTools, and Google Search Console. Using the right tool for the right question saves significant diagnostic time.
The practical workflow is sequential, not competitive:
Dashboard first: identifies which metric is failing and on which page type. This tells you where to look.
PageSpeed Insights or Chrome DevTools: diagnoses the specific element causing the failure. This tells you what to fix.
Google Search Console CWV Report: confirms how Google is seeing your performance data and flags any impact on ranking. This tells you whether the fix is registered in the signal Google uses.
Monitor dashboard for 2 – 4 weeks: confirms the fix improved real user experience, not just the simulated score.
Running PageSpeed Insights first and acting on its suggestions without cross-referencing dashboard data means you may be optimising for a synthetic test that does not reflect your actual ranking signal. The diagnostic tools are useful. The field data is authoritative.
How to Prioritise Performance Fixes Based on Dashboard Data
Not every performance problem warrants the same investment. Fixing a CLS score of 0.08 on desktop for a store doing 50 sessions per day is not the same priority as fixing a mobile LCP of 4.2 seconds on product pages for a store receiving 500 daily visitors. The dashboard gives you everything you need to make that prioritisation decision correctly.
Shopify's own guidance is worth stating directly: if your store has fewer than 100 sessions per day, focus on driving traffic before optimising performance. At low traffic volumes, the ranking impact is smaller and the RUM data is too thin to be statistically reliable.
The Impact × Traffic Prioritisation Framework
The sequencing principles:
- Fix mobile before desktop Google's ranking is based on mobile
- Fix LCP before INP before CLS failure rates on Shopify follow that order, and LCP has the highest direct impact on bounce rate
- Fix your highest-traffic page type first for most stores, product pages drive more revenue than collection pages, which drive more than the homepage
- Use the distribution bar to understand severity 5% of users in "Poor" is very different from 40%
A practical illustration: A D2C beauty brand in the UAE runs performance-targeted Instagram ads that link directly to product pages. Their dashboard shows homepage LCP at 1.9 seconds (Good) and product page LCP at 3.8 seconds (Poor) on mobile.
The homepage looks fine. But every paid traffic visitor lands on a failing page. The fix belongs on product pages, regardless of where the audit naturally starts.
How We Use the Shopify Web Performance Dashboard at Suplex
The Web Performance Dashboard is the starting point for every Shopify store audit Suplex runs. Before we look at theme code, app configurations, or image files, we need to know what real users are experiencing and on which page types the failures are most damaging. The dashboard answers both questions in under five minutes.
Our diagnostic process is consistent. Dashboard to identify which metric and which page type is failing → Event annotations to identify what caused the regression → Chrome DevTools to isolate the specific element → Fix → Monitor dashboard for 3 – 4 weeks to confirm the improvement in real user data.
When we review event annotation timelines during audits, we consistently find performance regressions that correlate directly with app installations, social proof widgets, upsell tools, loyalty programmes that were added with good commercial intentions and nobody connected to the resulting slowdown.
The dashboard surfaces these correlations in minutes. We treat every app installation as a performance test event, with a pre-install baseline recorded and a post-install check scheduled for 72 hours later.
We have applied this process across D2C and FMCG brands including Miduty, Kooji, and The Daily Bean, where performance optimization is embedded into the development and launch process not added after the store is live and already losing ranking ground.
If your dashboard is showing amber or red scores and you are not sure where to start, our Shopify audit gives you a prioritised, revenue-focused action plan built from your actual RUM data not a generic checklist of standard fixes.
Setting Up Ongoing Performance Monitoring: Not Just a One-Time Fix
Performance is not a project with a completion date. Every app installation, theme update, seasonal campaign and code deployment is a potential regression event.
Stores that treat performance optimization as a one-time task discover problems months later, when ranking damage and conversion losses have already compounded.
The event annotations built into the dashboard provide a persistent, automatic record of what changed when.
But they only serve as a diagnostic tool if someone is looking at the dashboard regularly enough to notice a regression before it sits unaddressed for six weeks.
The Monitoring Discipline That Prevents Compounding Problems
Establish a before/after testing habit for every store change: before installing any new app, record your current LCP, INP, and CLS scores from the dashboard. Check again after 48 – 72 hours.
This takes less than five minutes and makes regression detection immediate rather than accidental.
After any major theme update or custom development deployment, allow 2 – 4 weeks of RUM data to accumulate before evaluating whether the performance improvement shows up in real user scores.
Synthetic test tools will show you the improvement immediately. Field data takes time to aggregate.
Set up Core Web Vitals alerts in Google Search Console. You can configure email notifications for when any Core Web Vital drops below the "Good" threshold which means you receive a notification before you next think to check the dashboard manually.
Frequently Asked Questions
Where is the Shopify Web Performance Dashboard?
Go to Shopify Admin → Online Store → Themes. The performance summary banner sits at the top of the Themes page, click it to open the full dashboard. You can also access it via Analytics → Reports. You need the Reports staff permission enabled, and your store's password protection must be removed for real user data to populate.
What replaced the old Shopify Speed Score?
The old Shopify Speed Score, a single number based on a Lighthouse simulation, was replaced by the Web Performance Dashboard in January 2024. The new dashboard uses Real User Metrics from actual shoppers and tracks three Core Web Vitals: LCP (loading speed), INP (interactivity), and CLS (visual stability). This is the data Google uses for search ranking decisions.
Why is my Shopify Web Performance Dashboard showing no data?
The most common reason is that your store's password protection is still enabled. The dashboard requires real visitor traffic to populate it and cannot collect RUM data from passworded stores. A new store with fewer than 100 daily sessions may also show limited or unstable data. In that case, prioritise traffic acquisition before acting on performance metrics. The data will not be statistically reliable at very low session volumes.
Does the Shopify Web Performance Dashboard affect my Google ranking?
The metrics it tracks LCP, INP, and CLS are Google's confirmed Core Web Vitals ranking factors. Google evaluates these at the 75th percentile from real Chrome user sessions. A dashboard showing "Needs Improvement" or "Poor" on mobile directly signals that Google is likely ranking your store lower in mobile search results than competitors with "Good" scores.
How often does the Shopify Web Performance Dashboard update?
Data can be delayed by up to 36 hours due to tracking and aggregation processes. It is not a real-time tool. After making store changes installing or removing an app, publishing a theme update waits at least 48 – 72 hours before evaluating the impact. For meaningful trend analysis, use a 30-day or 90-day date range rather than the default short window.
What is a good LCP score on Shopify?
A good LCP score is 2.5 seconds or under at the 75th percentile. The median mobile LCP across Shopify stores sits at approximately 2.26 seconds close enough to the threshold that a single unoptimised hero image or extra app script pushes many stores into "Needs Improvement." Product pages consistently have worse LCP than homepages due to high-resolution product images loaded above the fold.
How do I use event annotations on the Shopify Performance Dashboard?
Event annotations are numbered vertical markers on the performance timeline graph. Hover over each marker to see what store change occurred, app installed, theme published, code deployed. If your LCP or INP worsened, identify the nearest annotation before the regression. In most cases, the logged event is the direct cause, giving you a specific starting point for diagnosis rather than requiring a broad audit of your entire store configuration.
Hi, I’m Rishabh Jain
I believe great design has the power to shape perception, build trust, and move businesses forward. That belief is what led me to found Suplex Design Studio, a global branding and packaging studio working with FMCG and D2C brands across markets.I started suplex at 25 with a clear intent, to create design that is strategic, thoughtful, and commercially meaningful. By 28, the studio had scaled globally, guided by a strong foundation in Integrated Design that I developed during my academic journey in London, where I was honoured with the Dean’s Award.
Over the years, I’ve had the opportunity to work with 100+ brands, from Fortune 500 organizations to family-run businesses, helping them build packaging and brand systems that create recall, relevance, and long-term value.
Suplex’s work has been recognized internationally, including the Manifest Award (2024), the Clutch Global Award (2025), and features on platforms such as Packaging of the World, The Dieline, and the World Brand Design Society.
None of this would be possible without the people behind the work. I’m deeply grateful to the suplex team, whose commitment, creativity, and attention to detail turn ideas into meaningful brand experiences every day.
At the heart of my work is a simple philosophy, design should be intentional, honest, and built to last, and that continues to guide everything we create at suplex.






























Let’s Make It Happen
E-Commerce Success Stories
%201.avif)






.avif)
.avif)
Build Your D2C Business The Right Way
Build It With Suplex.


