Ecommerce Customer Journey Mapping: From Map to Measurable Fix (2026)
.avif)

Ecommerce Customer Journey Mapping: From Map to Measurable Fix (2026)
Ecommerce customer journey mapping is the process of tracking every stage a shopper moves through, from first discovering your brand to buying, keeping and recommending it.
Most journey maps get built, presented once in a workshop, and never touched again, because they describe the customer without specifying what the business should actually change.
This Suplex guide helps you identify and fix issues at every stage instead of just tracking performance.
What An Ecommerce Customer Journey Map Actually Needs To Contain
Most maps stop at stage, action, and emotion. That's not enough to act on, and here's the piece almost every template skips.
Beyond Stages And Emotions: The Fourth Column Most Maps Skip
The standard journey map structure lists a stage, what the customer does, and how they feel. "Anxious about shipping costs" reads fine on a slide.
It tells you nothing about whether that anxiety is actually happening in your store or whether someone assumed it from a generic template.
Every stage needs a fourth column: the specific data source that backs up the claim. Call it the Signal Stack, the exact place you'd go to confirm or disprove what the map says is happening.
Without this column, a journey map is a story someone told about your customers. With it, it's a set of claims you can check against real numbers, and every claim that doesn't hold up gets cut before it wastes anyone's time chasing a fix for a problem that doesn't exist.

The Five Stages, Mapped To Ecommerce-Specific Touchpoints
This part of the topic is well covered everywhere, so we'll keep it tight, useful for completeness, not where the real value of this guide sits.
- Awareness: Product discovery through search, social, and paid ads.
- Consideration: PDP browsing, review reading, comparison shopping.
- Decision: Cart, checkout, shipping calculator, payment method selection.
- Retention: Order confirmation, tracking, unboxing, first post-purchase touch.
- Advocacy: Loyalty programme engagement, reviews, UGC requests, referrals.
Each stage needs its own ecommerce-specific touchpoints mapped against it, not a generic B2B or SaaS journey template dressed up for retail.
How To Map The Journey Using Real Store Data, Not Assumptions
This is where the piece earns its keep. Most journey mapping content stays conceptual. Here's the actual sequence, tool by tool.
Step 1: Pull Your Actual Funnel Numbers Before Mapping Anything
Start with GA4's funnel exploration report or Shopify's own funnel analytics, before you write a single sticky note.
This step gets mentioned constantly in competing guides, but almost none of them show you how to actually pull the number, so here it is plainly: in GA4, build a funnel exploration with your key steps (session, view_item, add_to_cart, begin_checkout, purchase) and look at the drop-off percentage between each step, not just the final conversion rate.
The global average ecommerce conversion rate sits around 2.5% to 3%. Use this as a reference point for where your funnel stands, not a promise of what you should hit, conversion rates vary hugely by category, price point, and traffic source.
Step 2: Layer In Qualitative Signal (Session Recordings, Heatmaps, Search Terms)
Numbers tell you where people drop off. They don't tell you why. Tools like Microsoft Clarity or Hotjar-equivalent session recording platforms, plus your on-site search query logs, fill that gap.
Here's the difference between a weak and a strong use of session recordings: watching five random sessions tells you almost nothing useful, you're sampling noise.
Filtering recordings specifically to sessions where the user added a product to cart and then left without completing checkout, that's where the actionable friction actually lives.
Watch those ten sessions instead of fifty random ones, and you'll see the same one or two sticking points repeat.
Site search query logs do something similar for the consideration stage: if shoppers keep searching for a size, colour, or spec you don't clearly show on the PDP, that's a specific, fixable content gap, not a vague "improve product pages" note.

Step 3: Turn Each Friction Point Into A Ranked Fix, Not A Note
A journey map that ends with a list of observations ("checkout feels slow," "PDP images could be better") produces nothing. Score every identified friction point on impact (how many customers does this affect, and how much revenue is at stake) and effort (how hard is this to actually fix), and rank the list.
High impact, low effort items go first. This is the difference between a journey map that becomes a slide deck nobody opens again and one that becomes an actual sprint backlog.
We run this exact data-layering step before recommending any CRO or redesign work. A competitor analysis often runs alongside this stage too, since knowing where your funnel sits relative to category benchmarks helps calibrate what counts as a real problem versus normal variance.
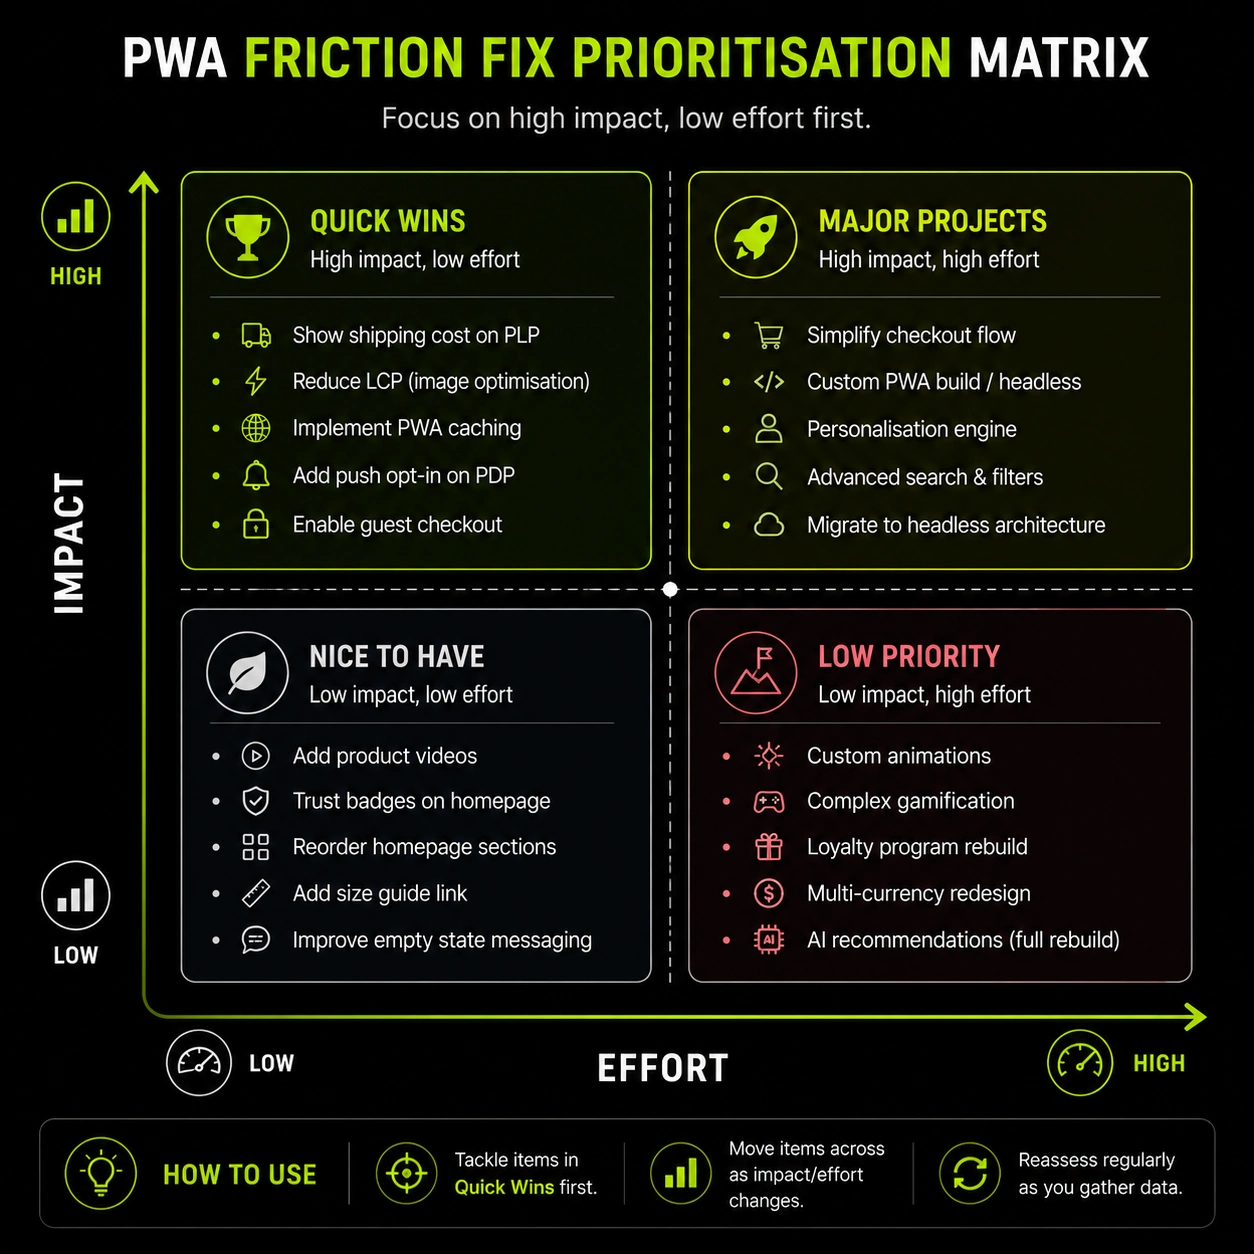
Where Ecommerce Brands Lose Customers In The Journey, and Why
Most content treats pain points as a bullet list to acknowledge and move past. Here's the actual cause-and-effect reasoning behind the two most common, highest-impact drop-off points.
Consideration-Stage Drop-Off: Hidden Shipping Costs
A brand can have excellent PDP copy, strong reviews, and fast page load times, and still bleed customers at checkout if shipping costs stay invisible until the final step.
This matters more than it sounds like it should, and here's why: a slow page load costs the customer time, which is annoying but expected and tolerated.
A shipping cost that appears for the first time at the final checkout step costs the customer trust, at the exact moment they are ready to commit.
The emotional cost of a late, unexpected charge is measurably higher than the cost of waiting a few extra seconds for a page to load, because one feels like friction and the other feels like being misled.
The fix isn't complicated, show shipping cost, or at least a clear estimate, on the PDP or in the cart, well before the final checkout step.
Retention-Stage Drop-Off: The Missing Post-Purchase Window
Most D2C brands build a beautiful acquisition funnel and then send nothing but a shipping confirmation email after the sale.
The 30 to 60 day window after delivery is where most brands lose the second-purchase opportunity entirely, and it's rarely because the product failed. It's because nothing in that window ever prompted the customer to come back and buy again.
A customer who had a perfectly fine experience with your product but received zero follow-up, no replenishment reminder, no complementary product suggestion, no simple "how's it going" touchpoint, has no reason to think of you again until they happen to need something similar and search from scratch.
That's a lost second purchase that a basic Klaviyo flow could have recovered.
The Before/After That Actually Matters
Here's what separates a journey map that produces action from one that doesn't, using the Decision stage as the example.
Weak Mapping: "Decision stage: customer clicks buy."
Strong Mapping: "Decision stage: customer checks 3 shipping options, and abandons if COD isn't visible before the final step."
The first version tells you nothing to build. The second version is an actual ticket: surface COD as a payment option earlier in the checkout flow, before the final page.
One produces a backlog item with a clear owner. The other produces a diagram nobody can act on.
Suplex's Approach To Journey Mapping
We treat journey mapping as a diagnostic step that produces a prioritised list of fixes, not a standalone workshop deliverable that gets presented once and filed away.
Our process combines quantitative funnel data with qualitative session behaviour before we recommend any UX, CRO, or redesign work. The journey map has to justify the fix. A fix is never justified simply because the map exists.
A stage only gets prioritised when the data shows genuine friction.
- Measurable drop-off → Investigate and fix.
- No measurable friction → Lower priority.
Workshop discussions help generate hypotheses, but behavioural data determines the roadmap.
This approach has shaped previous client work. Celesti (Skincare) focused on improving conversion rates and reducing drop-offs based on actual funnel behaviour. Miho (Fashion) used persona-driven UX improvements built around how shoppers actually navigated the site. Neither project was presented as a journey mapping exercise, but both followed the same discipline: pairing behavioural data with design decisions.
A journey map without an execution plan is a slide deck, not a strategy. The real measure of success is whether it drives prioritised decisions and measurable improvements.
Mapping the customer journey for UAE and Gulf ecommerce brands
A US or UK journey map template applied directly to a UAE brand will miss touchpoints that genuinely drive purchase decisions here. The region needs its own map, not a translated version of someone else's.
Discovery Leans On Instagram, Tiktok, And Influencers, Not Just Search
Awareness-stage discovery in the UAE runs heavily through Instagram, TikTok, and influencer content, more so than organic search alone drives in many Western markets.
A journey map built around search-first discovery misrepresents how UAE shoppers actually find new brands.
The Awareness stage touchpoint mix needs to reflect this, with social and influencer-driven discovery weighted appropriately against paid and organic search.
Whatsapp Is A Real, Invisible-To-GA4 Touchpoint
Many consideration-stage questions in the Gulf, sizing, COD availability, delivery timing, happen in WhatsApp threads entirely outside your website's own analytics.
A UAE journey map built only from GA4 data is structurally incomplete, it's missing an entire pre-purchase conversation channel that GA4 has no visibility into at all.
If your team fields these questions through WhatsApp regularly, that volume and those recurring questions belong in the map as a genuine Consideration-stage touchpoint, even though no analytics platform captures it automatically.
COD Needs Its Own Decision-Stage Signal
COD remains a dominant payment preference across the Gulf. The Decision stage needs a specific signal for COD-eligible order drop-off versus prepaid order drop-off, because the friction points genuinely differ between the two.
A prepaid shopper drops off over price or trust in the payment gateway. A COD shopper drops off over delivery timing uncertainty or whether COD is even visible as an option before they commit to the checkout flow.
Mapping both under one generic "checkout drop-off" number hides which problem you're actually solving.
Ramadan and EOSS Distort a Single Static Map
Ramadan and EOSS (End of Season Sale) periods create seasonal traffic spikes that don't behave like the rest of the year, different discovery patterns, different urgency, different price sensitivity. A single static journey map built from average annual data will misrepresent both the calm periods and the spike periods. Gulf brands are better served maintaining a seasonal variant of the map alongside the standard one, rather than treating one static version as accurate year-round.
We've mapped these region-specific touchpoints, WhatsApp, COD, influencer-driven discovery, into the standard framework for UAE D2C and FMCG brands as a Shopify, Meta, and Google Partner working across the Gulf market.
The touchpoints themselves aren't optional additions, they're where a meaningful share of the actual purchase decision happens.
Frequently Asked Questions
What are the 5 stages of the ecommerce customer journey?
Awareness, Consideration, Decision, Retention, and Advocacy. Awareness is discovery through ads, search, or social. Consideration is product research and comparison. The decision is checkout. Retention covers the post-purchase and repeat-purchase window. Advocacy is reviews, referrals, and loyalty. Each stage needs its own touchpoints and data signals, not a generic template.
What are the 7 steps to map a customer journey?
Define objectives, identify customer personas, map every touchpoint, layer in customer emotions and behaviours, identify pain points and opportunities, visualise the map, then validate and iterate it with stakeholders and real data. The step most ecommerce maps skip is validating each assumption against actual funnel and session data.
What tools are used for ecommerce customer journey mapping?
GA4 for funnel and acquisition data, Microsoft Clarity or similar tools for session recordings and heatmaps, Klaviyo or equivalent for post-purchase flow performance, and a visual tool like Miro or FigJam to lay out the map itself. The tool matters less than pairing quantitative and qualitative data together.
How is an ecommerce journey map different from a general customer journey map?
An ecommerce map is anchored to transactional touchpoints, PDP, cart, checkout, shipping, order tracking, and ties directly to conversion rate and repeat purchase rate. A general CX journey map, used in banking or SaaS, for example, covers longer, less transactional relationship stages.
How often should an ecommerce customer journey map be updated?
At minimum, after any major site redesign, platform migration, or significant traffic-source shift. Brands with strong seasonal cycles, Ramadan, EOSS, Black Friday, benefit from a seasonal variant rather than treating one static map as accurate year-round.
What causes the biggest drop-off in the ecommerce customer journey?
Checkout-stage drop-off tied to unexpected costs (shipping, taxes) revealed late in the process is one of the most common and highest-impact points, alongside a weak or missing post-purchase flow that fails to prompt a second purchase within the first 30 to 60 days.
Do you need a customer journey map before doing conversion rate optimisation?
Not strictly, but skipping it means CRO fixes are often guesses. A journey map backed by funnel and session data tells you which stage to prioritise first, so CRO effort goes toward the highest-impact friction point rather than the most visible one.
Hi, I’m Rishabh Jain
I believe great design has the power to shape perception, build trust, and move businesses forward. That belief is what led me to found Suplex Design Studio, a global branding and packaging studio working with FMCG and D2C brands across markets.I started suplex at 25 with a clear intent, to create design that is strategic, thoughtful, and commercially meaningful. By 28, the studio had scaled globally, guided by a strong foundation in Integrated Design that I developed during my academic journey in London, where I was honoured with the Dean’s Award.
Over the years, I’ve had the opportunity to work with 100+ brands, from Fortune 500 organizations to family-run businesses, helping them build packaging and brand systems that create recall, relevance, and long-term value.
Suplex’s work has been recognized internationally, including the Manifest Award (2024), the Clutch Global Award (2025), and features on platforms such as Packaging of the World, The Dieline, and the World Brand Design Society.
None of this would be possible without the people behind the work. I’m deeply grateful to the suplex team, whose commitment, creativity, and attention to detail turn ideas into meaningful brand experiences every day.
At the heart of my work is a simple philosophy, design should be intentional, honest, and built to last, and that continues to guide everything we create at suplex.



































Let’s Make It Happen
E-Commerce Success Stories
%201.avif)






.avif)
.avif)
Build Your D2C Business The Right Way
Build It With Suplex.


