Average Ecommerce Conversion Rate by Industry: 2026 Benchmarks and What to Do With Them
.avif)
Average Ecommerce Conversion Rate by Industry: 2026 Benchmarks and What to Do With Them
The average ecommerce conversion rate in 2026 is 1.8% to 3%, depending on how it is measured. That range sounds useful. But it's not.
A food and beverage store converting at 3% may be underperforming. A luxury jewellery brand at 1% may be running a healthy funnel.
The global average is not your benchmark. Your industry average is. This post gives you both and a diagnostic framework to act on them.
How Ecommerce Conversion Rate Is Calculated and Why Definitions Matter
Before comparing your number to any benchmark, you need to know what that benchmark is actually measuring.
Most confusion around conversion rate data comes from comparing numbers that were calculated differently.
The Formula
Conversion rate (%) = (Number of completed orders ÷ Number of sessions) × 100
Simple in principle. Three variables create real variation in practice.
1. What counts as a "session"
Some platforms count all visits, bounces, bots and internal traffic. Others filter to qualified sessions with more than one page view or a minimum visit duration.
A store reporting all sessions will show a lower CVR than the same store filtered to engaged sessions. This is the main reason Shopify's platform-wide average (1.4% via Littledata) is lower than Shopify's own "typical store" figure of 2.5–3%.
2. What counts as a "conversion"
Most ecommerce metrics count completed purchases. Some include email sign-ups, account registrations, or add-to-cart events. Always confirm the definition before comparing any external benchmark to your own data.
3. The time period
Conversion rates are seasonal. A fashion brand's December rate will differ materially from its July rate. Trailing 12-month averages are the most reliable comparison period.
Practical note: When comparing your store's CVR to any benchmark in this post, use session-based data from Shopify Analytics or GA4 with the same session definition.
The most common mistake is comparing Shopify Analytics data to a Google Analytics benchmark; they count sessions differently, and the gap can distort your conclusions.
The 2026 Global Benchmark, What the Data Actually Shows
Multiple credible sources report different global averages. This is not contradictory. It reflects genuine differences in who and what is being measured.
Why Different Sources Report Different Numbers
The range of 1.4% to 3.0% across reputable sources reflects sample composition more than actual store performance.
Enterprise retailers inflate some averages. New stores drag down platform-wide figures.
The Practical Takeaway: If you are on Shopify, Littledata's 1.4% and Shopify's 3.2% top-20% threshold are your most directly relevant reference points. Above 1.4% means you are already outperforming the platform average. Above 3.2% puts you in the top 20%.
Average Ecommerce Conversion Rate by Industry 2026 Data
This is the section most people search for. The benchmarks matter but the reasons behind them matter more. Both are covered here.
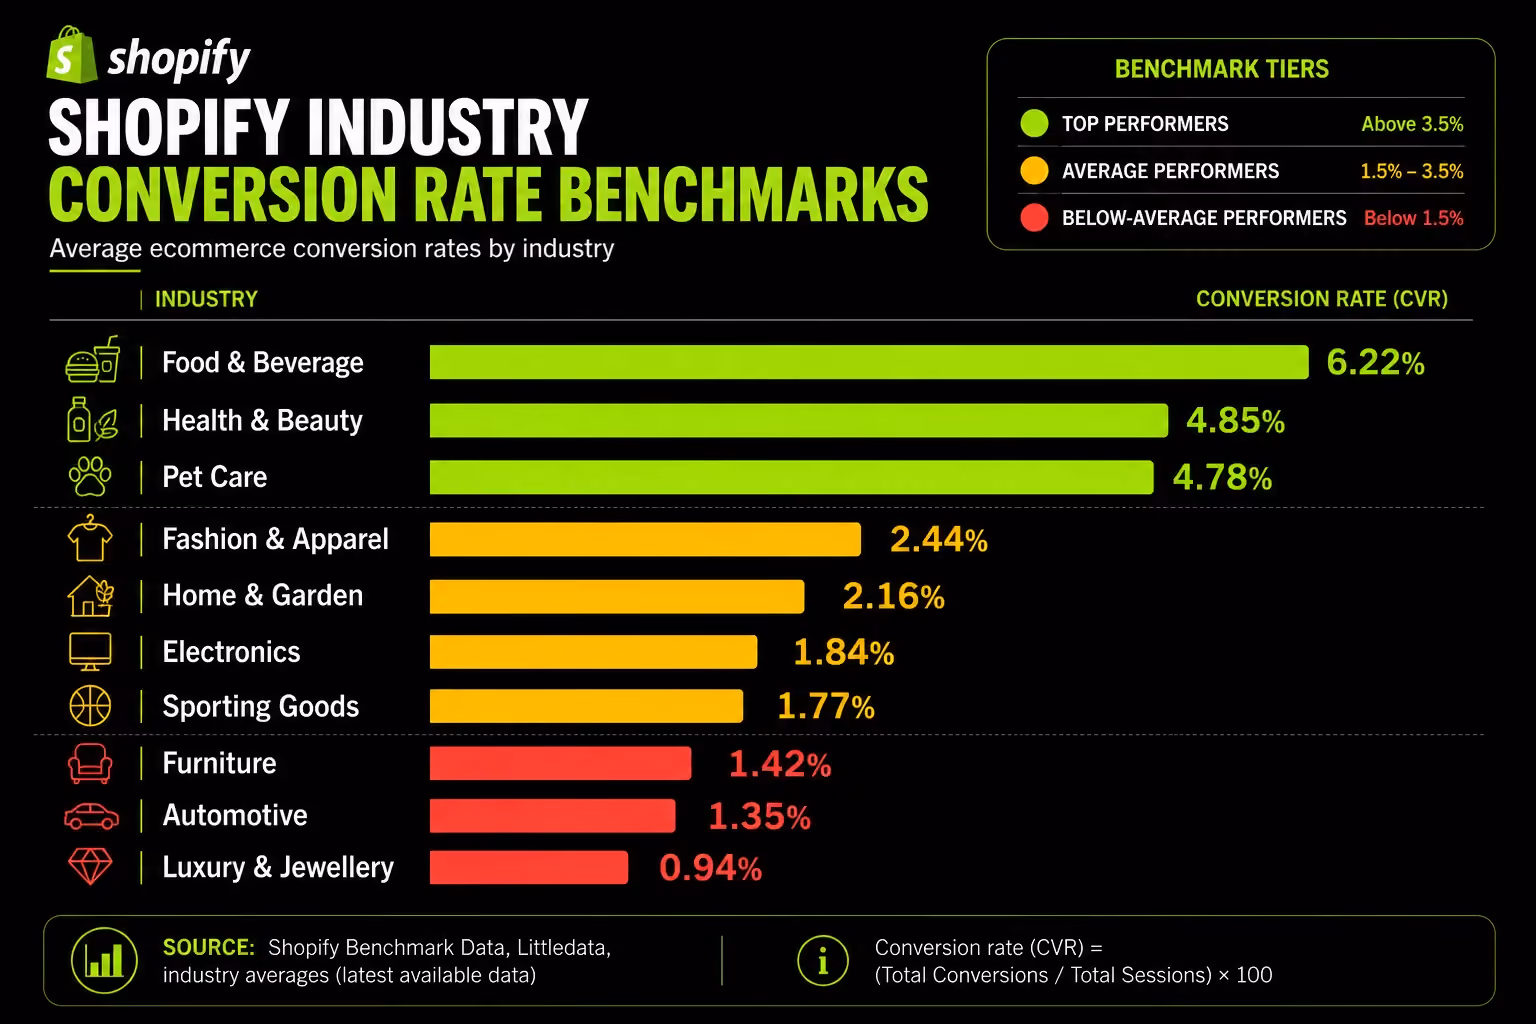
Industry Benchmark Table
Source: Shopify 12-month rolling data per Propel Commerce (2026) and industry analyses citing Dynamic Yield data. Ranges reflect sub-category variation, geography, and traffic mix.
Food and beverage converts at 6.22%. Luxury and jewellery averages 0.94%. That is a 6.6× difference between two industries on the same platform.
The global average of 2.5% sits between these two extremes and tells you almost nothing about either one.
Why Industries Convert So Differently, The Three Structural Drivers
Most benchmark posts present these numbers without explaining the mechanics. The three structural factors below do more work than the table itself.
Driver 1: Average Order Value (AOV)
Lower-priced items require less deliberation. A £12 packet of protein bars has a near-zero commitment threshold.
A £1,400 sofa requires research, comparison and often a physical touchpoint before an online purchase completes. AOV is the single strongest predictor of conversion rate at the category level.
A 2026 first-party study of 21 Shopify stores generating $688 million in combined annual revenue found that AOV bracket explained conversion variance better than vertical.
Brands in the same category with different AOV profiles behave like entirely different categories.
Driver 2: Purchase Frequency
Repeat buyers convert at 4.5–6.0%. First-time visitors convert at 1.0–2.0%. Categories built on repeat purchase food, supplements, pet food, beauty consumables accumulate a high proportion of returning visitors who already trust the brand and skip the evaluation phase.
Categories built on considered, infrequent purchases face a cold-start problem with every session.
Driver 3: Product Tangibility
Products that consumers need to see, touch, or try before committing generate more browsing sessions that do not convert. Jewellery requires seeing how it looks worn. Furniture requires understanding scale.
Fashion requires confidence in fit. No product page copy eliminates these barriers entirely; it only reduces them. The residual effect is a structurally lower CVR for tangibility-dependent categories, regardless of store quality.
This is why comparing a UAE luxury accessories brand's 0.8% CVR to a global average of 2.5% creates anxiety with no useful action. The comparison is structurally wrong.
The correct question is: how does our 0.8% compare to other luxury brands in our AOV range? That reveals an actual optimisation opportunity.
If you want a structured read on whether your store's design is contributing to conversion loss, Suplex's ecommerce website audit checklist covers the 11 checks that most often reveal hidden revenue leaks.
Shopify Conversion Rate Benchmarks Platform-Specific Data
Shopify-specific data is more relevant for most readers than generic ecommerce averages. Here is what Littledata's Q1 2026 benchmark across thousands of Shopify stores actually shows.
The Shopify Performance Tiers
Beyond sitewide CVR, two funnel-level benchmarks reveal where revenue is actually being lost.
Add-to-cart rate (Shopify/Littledata):
- Platform average: 4.6%
- Top 20%: 7.5%+
- Top 10%: 9.6%+
Checkout completion rate (Littledata):
- Platform average: 45%
- Top 20%: 59%+
- Top 10%: 66%+
The checkout completion rate is one of the most overlooked metrics in ecommerce. If your add-to-cart rate is above 4.6% but your sitewide CVR is below 1.5%, the problem is not product interest, it is checkout friction. These two numbers together locate the problem more precisely than CVR alone.
What a "Below Average" Shopify Conversion Rate Actually Tells You
A store below 1.4% is almost always experiencing one or more of four specific problems.
- Traffic quality mismatch: Top-of-funnel social traffic (paid social CVR: 0.7–1.2%) arriving at pages designed for high-intent buyers. The audience is wrong for the page, not the page itself.
- Trust deficit: No reviews, weak trust signals, or a checkout that does not inspire confidence. Particularly acute for newer stores.
- Checkout friction: Too many steps, required account creation, limited payment methods, unclear delivery expectations. The Baymard Institute estimates better checkout design alone could recover $260 billion in lost orders across the US and EU.
- Mobile UX failure: Over 70% of Shopify traffic arrives on mobile. A store not optimised for mobile checkout is converting at 40–50% of its potential.
Suplex's Shopify audit service starts exactly at this diagnosis identifying which of these constraints is costing the most revenue before recommending any intervention.
Conversion Rate by Traffic Source, The Most Actionable Benchmark
Traffic source benchmarks have the highest commercial decision-making value in this entire post. They are also the most underserved data point in competing content. Your channel mix determines your blended CVR more than almost any on-site factor.
2026 Traffic Source Benchmark Table
Email converts at 4–5× the rate of paid social. A brand spending 70% of its budget on Meta ads and nothing on email retention is systematically choosing the lowest-converting channel over the highest-converting one.
Retention infrastructure email capture, automated flows, segmented campaigns is a conversion multiplier most brands underinvest in relative to paid acquisition.
A paid social CVR of 1.0% is not a store problem. It is channel-appropriate performance. The mistake is expecting social discovery traffic to convert like search intent traffic.
The audit question to ask is: does our channel mix reflect the conversion behaviour of each channel, or are we comparing apples to oranges and creating false urgency around a "low" CVR?
WhatsApp marketing in the UAE and GCC has conversion characteristics closer to email than to social because it reaches an opted-in audience in a high-trust, conversational channel.
Brands building WhatsApp flows alongside email are effectively operating two high-converting owned channels. Brands relying purely on Instagram and Snapchat advertising do not have this structural advantage.
Understanding channel-level performance is exactly what Suplex's D2C data analytics service surfaces segmented by source, device, and funnel stage, so you know where to shift budget.
Conversion Rate by Device The 2026 Story Has Changed
This section contains the single most newsworthy data point in ecommerce benchmarking for 2026. Most competing content still describes a large mobile-desktop gap that no longer exists in optimised stores.
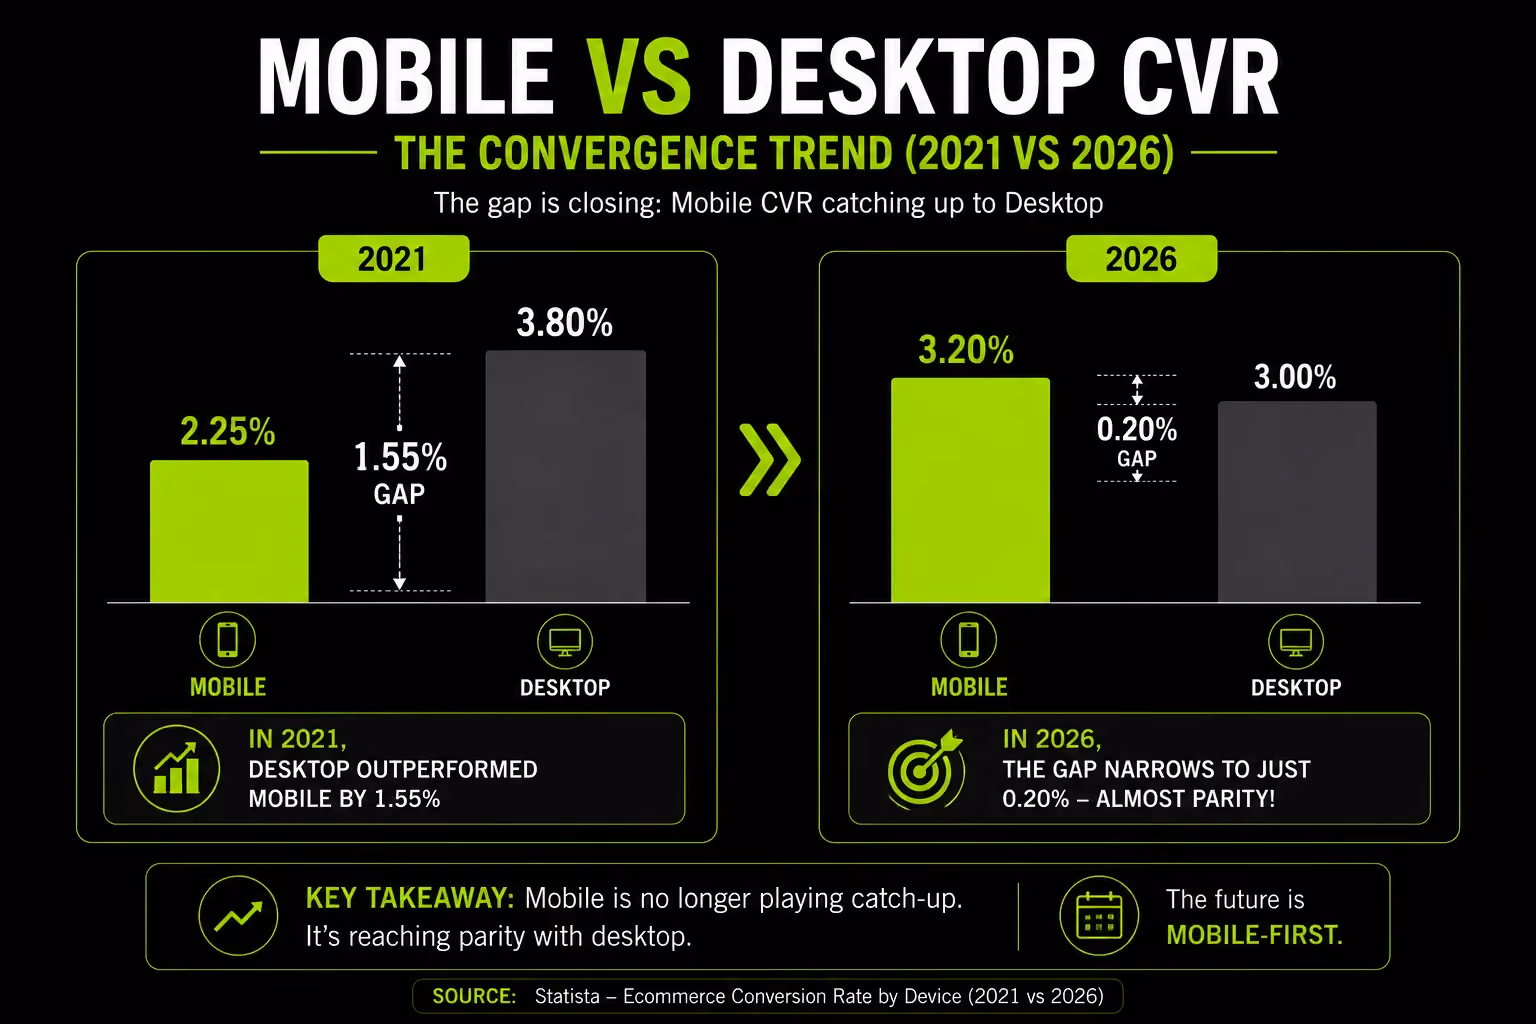
The 2026 Device Benchmark
Source: Dynamic Yield 2026 data (200M+ user sessions)
The mobile-desktop gap which stood at 1.5+ percentage points five years ago has narrowed to approximately 0.2 percentage points in 2026. Mobile now converts nearly at parity with desktop in well-optimised stores.
What Drove The Convergence:
- Express payment methods (Shop Pay, Apple Pay, Google Pay) eliminating form-fill friction at checkout
- Improved mobile page speed from CDN infrastructure and WebP image adoption
- Mobile-first theme design becoming standard rather than optional
- One-tap checkout reducing steps from cart to purchase
The practical implication: mobile optimisation is no longer a catch-up exercise. The brands still showing a 40–50% lower mobile CVR than desktop are not experiencing a universal mobile problem; they have a specific checkout or UX problem that is disproportionately affecting mobile users.
Important Caveat: Other sources (Smart Insights, Ringly.io) still show a larger gap desktop at 3.5–3.9%, mobile at 1.8–2.5%. Dynamic Yield's data likely reflects larger, more optimised merchant samples. Smaller stores probably still exhibit the traditional gap.
Use your own device-segmented Shopify Analytics or GA4 data as the primary reference, not the benchmark.
For stores with a persistent mobile-desktop gap, Suplex's mobile-first design service and performance optimisation work address the two most common causes: UX friction and slow load times on cellular.
The Conversion Rate Diagnostic Framework, What Your Number Actually Means
Every competing piece in this SERP stops at "here is the average." This section starts there and tells you what to do next. This is the highest-value content in this post, a named, structured diagnostic framework built from the real patterns seen across D2C and ecommerce brands.
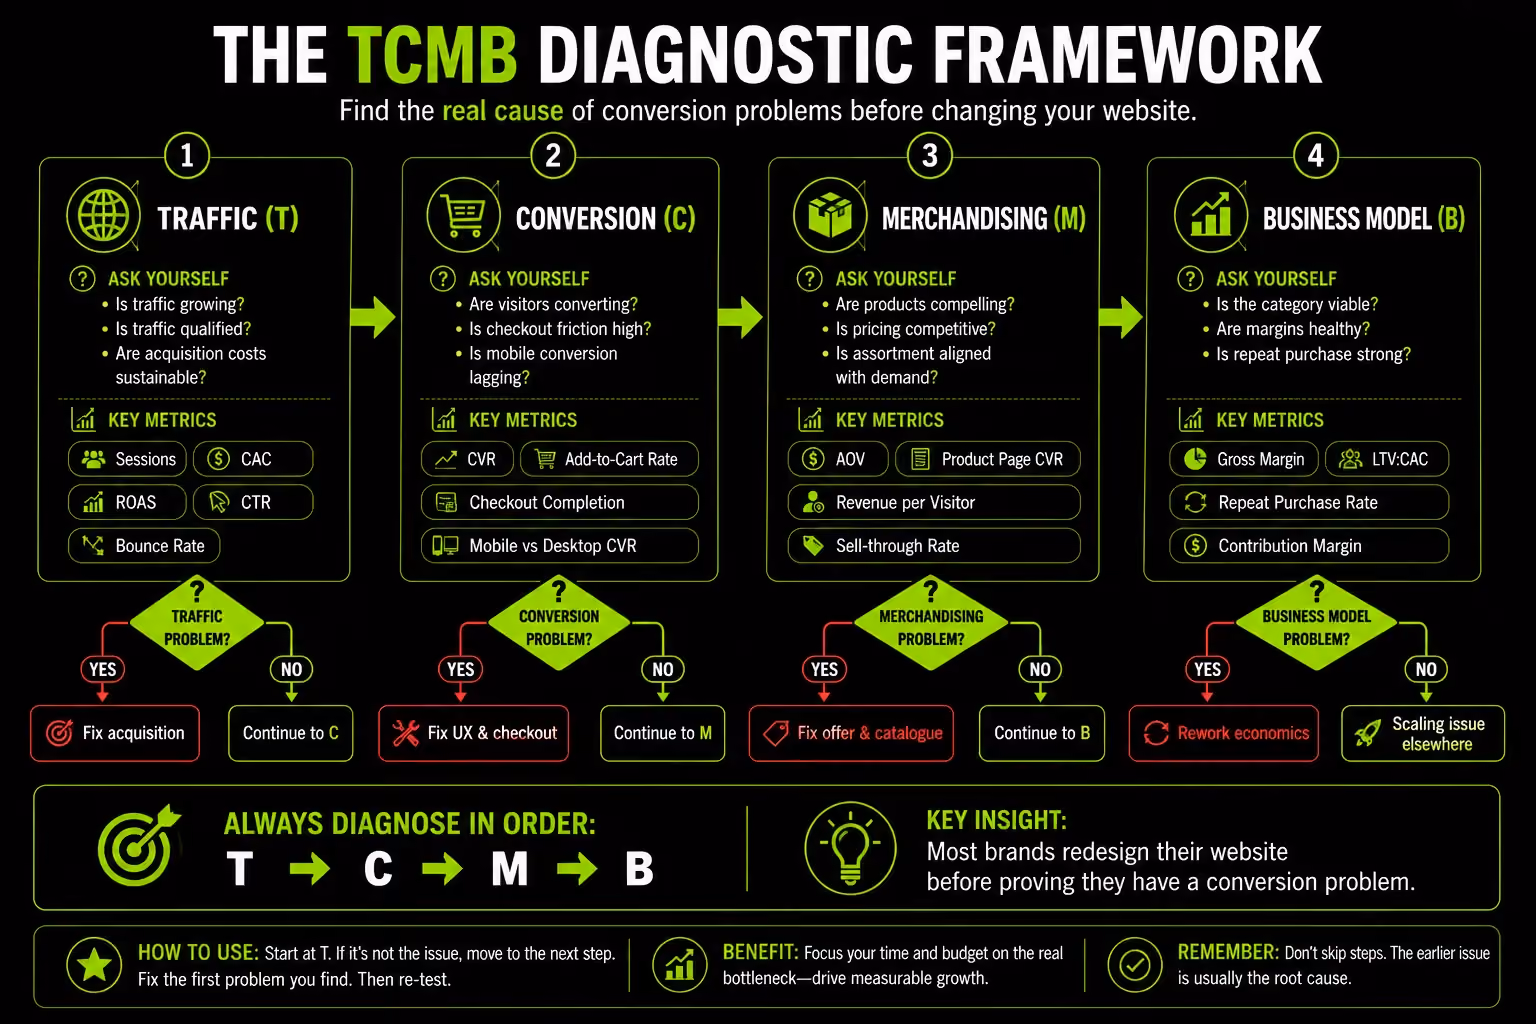
The TCMB Conversion Diagnostic (Suplex Framework)
Four levers drive the majority of conversion rate problems. The goal is to identify your primary constraint before spending budget or time on anything else.
T : Traffic Quality
Run this check first. Segment your CVR by traffic source in Shopify Analytics or GA4. If your email CVR is 4%+ but your blended CVR is 1.2%, your traffic mix is the problem not your store. More paid social traffic at 0.7% CVR is diluting a healthy email rate.
- Signal: Large gap between highest and lowest-converting channels. High session volume with low engagement (under 60-second average session time). High bounce rate from paid social landing pages.
- Fix: Shift budget toward higher-converting channels. Build your email and SMS list more aggressively. Improve paid social audience targeting to reduce low-intent session volume.
C : Checkout Architecture
Compare your add-to-cart rate to checkout initiation to purchase completion. A large drop from add-to-cart to checkout initiation signals a cart page or shipping cost problem. A large drop from checkout initiation to purchase signals a payment method or form friction problem.
- Signal: Add-to-cart rate above 4.6% but purchase CVR significantly below 1.4%. Checkout completion rate below 45%.
- Fix: Enable guest checkout. Add express payment options (Shop Pay, Apple Pay, Google Pay). Show delivery expectations on the product page not just at checkout. Remove unnecessary checkout steps.
M : Mobile Experience
Segment your CVR by device. If mobile CVR is below 60% of your desktop CVR, mobile friction is the primary constraint. Common causes: checkout form complexity on small screens, missing express payment options, slow product image loading on cellular, or a CTA buried below the fold.
- Signal: Mobile traffic above 60% of total sessions, mobile CVR below 1.5%, high mobile add-to-cart rate but low mobile checkout completion.
- Fix: Audit your checkout on a real device using a cellular connection. Enable Shop Pay and Apple Pay. Compress all product images to WebP. Move the primary CTA above the fold on mobile product pages.
B : Brand and Trust
The hardest constraint to fix quickly, and the most foundational. If traffic is healthy, checkout is clean, and mobile is optimised but CVR is still below 1.5% trust signals are likely the remaining barrier. Particularly acute for newer stores, stores with few reviews, or stores in risk-aware categories (health supplements, high-AOV fashion, children's products).
- Signal: High product page scroll depth (people are reading but not buying). High session time with low conversion. Low review count or reviews not visible above the fold.
- Fix: Integrate reviews with star ratings visible above the fold on all product pages. Add a clear return policy, money-back guarantee, and delivery expectation directly on product pages, not just in the footer. For supplement and health brands: add certifications, third-party testing badges, and ingredient transparency.
At Suplex, this four-part diagnostic is the starting point of every conversion rate optimisation engagement. The diagnosis comes before any design or development recommendation because a store converting at 1.1% with a 6% add-to-cart rate has a checkout problem, not a design problem. Those are different interventions with different costs and timelines.
UAE and Gulf Ecommerce Conversion Rate Context
This section is absent from every competing piece in the SERP. If your store operates in the UAE or GCC, the global benchmarks apply but with important local variables that directly affect conversion.
What Makes the Gulf Conversion Environment Different
The UAE ecommerce market reached $12.3 billion in 2026 with a projected CAGR of 22.4% through 2033. Fashion and apparel hold the largest category share at 21.59%.
Food and beverage is the fastest-growing category. Digital wallets now facilitate over 53% of all UAE ecommerce transactions.
Key Gulf-specific conversion considerations:
Payment method coverage is a conversion variable, not just a UX preference. In a market where cash on delivery still represents 30–40% of UAE transactions and digital wallets account for 53%, a checkout with only Visa and Mastercard will produce a structurally lower CVR.
This is not a traffic problem or a checkout UX problem, it is a payment accessibility problem. If your store does not offer COD and at least one BNPL option (Tabby or Tamara), you are excluding mainstream payment behaviours in this market.
Trust signals differ from Western markets. UAE consumers respond to local presence signals: a .ae domain, a UAE phone number, an Arabic language option, recognisable regional payment logos, and visible COD availability.
COD being present signals that the brand is confident enough in its product to allow payment on delivery. That matters.
Mobile is non-negotiable here. The UAE has one of the highest smartphone penetration rates in the world. Stores not optimised for mobile checkout face more acute conversion loss in the UAE than in lower mobile-penetration markets.
Category-specific notes for Gulf brands:
- Beauty and personal care: Halal certification and ingredient transparency are conversion factors, not just marketing signals. Display them on product pages, not just in brand materials.
- Fashion: Modest wear sizing and coverage detail are primary purchase decision factors for a significant portion of the UAE market. Stores missing these details are losing a segment to competitors who include them.
- Supplements: Informed Sport or equivalent certification significantly reduces purchase hesitation in a market where product quality anxiety is high.
For brands expanding into or within the Gulf, Suplex's international ecommerce setup service covers payment localisation, regional trust architecture, and the technical setup required for GCC markets.
How We Approach Conversion Rate at Suplex
Conversion rate is the first metric we examine in every audit and revisit after every major build. While LTV, AOV, and retention matter, conversion rate is the clearest indicator of whether a store’s experience is working.
Across UAE and Gulf brands, most conversion issues stem from one or two specific bottlenecks—not the entire store. Diagnosis comes before redesign.
A store converting at 1.1% with a 6% add-to-cart rate likely has a checkout problem, not a design problem. Rebuilding the site before identifying the cause is often an expensive mistake.
The biggest conversion gains typically come from fixing a single high-impact constraint: adding express checkout, improving mobile PDP structure, enabling COD, or increasing review visibility above the fold.
Relevant case studies:
- Miduty D2C supplement brand; supplement-category trust signals, review architecture, and certification visibility as conversion drivers
- Kooji Multi-SKU D2C; checkout optimisation and traffic source mix
- Tea Culture of the World Food and beverage; category-specific CVR and AOV optimisation
If you want to know which of the four conversion constraints is costing your store the most revenue and what the specific fix looks like, Suplex's Shopify audit starts exactly there.
How to Improve Your Ecommerce Conversion Rate High-Impact Actions by Constraint
These are not generic CRO tips. Each action is mapped to the specific constraint it addresses.
If Traffic Quality Is the Constraint
- Audit your traffic source mix in Shopify Analytics. Calculate revenue contribution per source, not just session volume.
- Shift paid budget toward higher-intent channels branded search, retargeting, affiliate and referral away from cold top-of-funnel social if CVR is the primary goal.
- Build your email list with a meaningful incentive: 10% off, exclusive content, early access. Every email subscriber is a future 4–5% CVR session rather than a 0.7% paid social session.
- Align landing pages to traffic intent. High-intent branded search clicks should land on product or collection pages, not the homepage.
If Checkout Architecture Is the Constraint
- Enable Shop Pay, Apple Pay, and Google Pay immediately. Express checkout options reduce steps from 4–6 to 1 and have been documented to increase checkout completion by 15–30%.
- Enable guest checkout. Account creation requirements are among the top three causes of checkout abandonment.
- Show delivery expectations on the product page not at checkout. Surprise shipping costs or delivery timelines at checkout drive 48% of cart abandonments.
- For UAE and Gulf stores: enable COD and at least one BNPL option. These are not edge cases in this market.
- Reduce checkout to the minimum required fields. Every unnecessary form field increases abandonment probability.
For checkout-specific improvements, also read Suplex's guide on signs your ecommerce website needs a redesign it covers when checkout issues warrant a full-funnel rebuild versus a targeted fix.
If Mobile Experience Is the Constraint
- Test your checkout on a real phone, on a cellular connection, not WiFi. The experience your analytics shows is not the experience most of your customers have.
- Move the primary CTA (Add to Cart / Buy Now) above the fold on mobile product pages. If a customer has to scroll to find the button, you are losing a measurable portion of mobile converts before they commit.
- Compress all images to WebP and implement lazy loading. A product page that takes 4+ seconds to load on cellular loses 40%+ of mobile visitors before they see the product. Suplex's guide on Shopify speed optimisation covers this in detail.
- Remove sticky elements (pop-ups, banners, chat widgets) that cover the mobile viewport. On a 6-inch screen, an overlapping element is a conversion blocker.
See also: Ecommerce mobile optimisation best practices for a full implementation guide.
If Brand and Trust Is the Constraint
- Display star ratings and review count immediately below the product title above the price, above the description. This is the single highest-leverage trust signal placement.
- Add a visible return policy and delivery guarantee on every product page not just in the footer. "Free returns within 30 days" shown near the CTA reduces purchase risk perception.
- For supplement and health brands: display certifications (Informed Sport, Halal, vegan) in the product title area or directly adjacent to it.
- Add a short "What makes this different" section on product pages for considered-purchase categories. A one-paragraph brand context statement reduces cold visitor hesitation.
FAQs
What is the average ecommerce conversion rate in 2026?
The global average ecommerce conversion rate in 2026 is 1.8%–3%, depending on the methodology and sample. Shopify's platform-wide average is 1.4% (including new and unoptimised stores), while established Shopify stores typically see 2.5–3%. Stores above 3.2% are in the top 20% of all Shopify merchants. Above 4.7% places a store in the top 10%.
What is a good ecommerce conversion rate?
It depends entirely on your industry. For food and beverage, 3% is below average. For luxury goods, 1% can indicate a well-performing store. As a general reference: below 1% suggests a fixable problem; 1–2% is functional but has significant headroom; 2–3% is healthy; above 3% places most stores among the best in their category.
What is the average Shopify conversion rate?
Shopify's platform-wide average is 1.4% according to Littledata's Q1 2026 benchmark data. Established Shopify stores typically convert at 2.5–3%. Top-performing stores (top 20%) exceed 3.2%. Top 10% exceed 4.7%. Shopify's industry averages range from 6.22% (food and beverage) to 0.94% (luxury and jewellery).
Which industry has the highest ecommerce conversion rate?
Food and beverage consistently leads all industries at approximately 6.22% average according to Shopify's 12-month rolling data. Beauty and personal care follows at 4.94%. These rates reflect low AOV (less purchase friction), high purchase frequency (returning customers who skip evaluation), and the consumable nature of the products.
Why do luxury ecommerce brands have lower conversion rates?
Luxury brands convert at 0.5–1.2% because of three structural factors: high AOV requires more deliberation before purchase; products are tangibility-dependent (customers want to see jewellery worn or handle materials); and purchase frequency is low, meaning a higher proportion of sessions are first-time, cold-audience visits. A luxury brand at 0.9% is not underperforming; it is within the normal range for its category.
Hi, I’m Rishabh Jain
I believe great design has the power to shape perception, build trust, and move businesses forward. That belief is what led me to found Suplex Design Studio, a global branding and packaging studio working with FMCG and D2C brands across markets.I started suplex at 25 with a clear intent, to create design that is strategic, thoughtful, and commercially meaningful. By 28, the studio had scaled globally, guided by a strong foundation in Integrated Design that I developed during my academic journey in London, where I was honoured with the Dean’s Award.
Over the years, I’ve had the opportunity to work with 100+ brands, from Fortune 500 organizations to family-run businesses, helping them build packaging and brand systems that create recall, relevance, and long-term value.
Suplex’s work has been recognized internationally, including the Manifest Award (2024), the Clutch Global Award (2025), and features on platforms such as Packaging of the World, The Dieline, and the World Brand Design Society.
None of this would be possible without the people behind the work. I’m deeply grateful to the suplex team, whose commitment, creativity, and attention to detail turn ideas into meaningful brand experiences every day.
At the heart of my work is a simple philosophy, design should be intentional, honest, and built to last, and that continues to guide everything we create at suplex.


Let’s Make It Happen
E-Commerce Success Stories
%201.avif)


.avif)
.avif)
Build Your D2C Business The Right Way
Build It With Suplex.


